Estimated Value: $532,000 - $601,594
5
Beds
2
Baths
1,483
Sq Ft
$375/Sq Ft
Est. Value
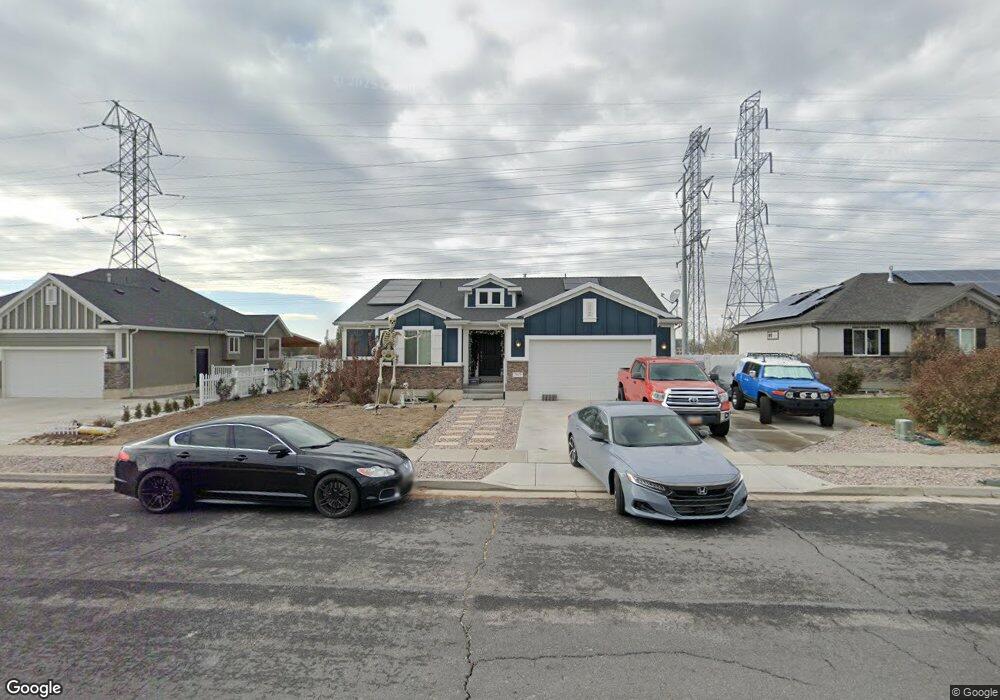
About This Home
This home is located at 5633 S 3200 W, Roy, UT 84067 and is currently estimated at $555,649, approximately $374 per square foot. 5633 S 3200 W is a home located in Weber County with nearby schools including Roy Elementary School, Roy Junior High School, and Roy High School.
Ownership History
Date
Name
Owned For
Owner Type
Purchase Details
Closed on
Jan 21, 2016
Sold by
Ivory Homes Ltd
Bought by
Briggs James W
Current Estimated Value
Home Financials for this Owner
Home Financials are based on the most recent Mortgage that was taken out on this home.
Original Mortgage
$290,858
Outstanding Balance
$236,189
Interest Rate
4.62%
Mortgage Type
FHA
Estimated Equity
$319,460
Purchase Details
Closed on
May 20, 2009
Sold by
Burbs Llc
Bought by
Ivory Homes Ltd
Purchase Details
Closed on
Sep 22, 2008
Sold by
Ivory Development Llc
Bought by
Burbs Llc
Create a Home Valuation Report for This Property
The Home Valuation Report is an in-depth analysis detailing your home's value as well as a comparison with similar homes in the area
Home Values in the Area
Average Home Value in this Area
Purchase History
| Date | Buyer | Sale Price | Title Company |
|---|---|---|---|
| Briggs James W | -- | Cottonwood Title | |
| Ivory Homes Ltd | -- | Cottonwood Title Insurance A | |
| Burbs Llc | -- | None Available |
Source: Public Records
Mortgage History
| Date | Status | Borrower | Loan Amount |
|---|---|---|---|
| Open | Briggs James W | $290,858 |
Source: Public Records
Tax History Compared to Growth
Tax History
| Year | Tax Paid | Tax Assessment Tax Assessment Total Assessment is a certain percentage of the fair market value that is determined by local assessors to be the total taxable value of land and additions on the property. | Land | Improvement |
|---|---|---|---|---|
| 2025 | $3,511 | $565,186 | $188,468 | $376,718 |
| 2024 | $3,430 | $305,799 | $103,658 | $202,141 |
| 2023 | $3,426 | $306,900 | $98,102 | $208,798 |
| 2022 | $3,325 | $304,150 | $80,254 | $223,896 |
| 2021 | $2,978 | $451,000 | $97,999 | $353,001 |
| 2020 | $2,508 | $345,000 | $97,999 | $247,001 |
| 2019 | $2,428 | $315,000 | $22,345 | $292,655 |
| 2018 | $2,320 | $284,000 | $61,523 | $222,477 |
| 2017 | $2,318 | $268,000 | $61,523 | $206,477 |
| 2016 | $2,210 | $137,476 | $32,431 | $105,045 |
| 2015 | $1,108 | $64,129 | $64,129 | $0 |
| 2014 | $771 | $53,931 | $53,931 | $0 |
Source: Public Records
Map
Nearby Homes
- 3186 W 5625 S
- 3176 W 5625 S
- 3166 W 5625 S
- 5538 S 3150 W
- 3198 W 5825 S
- 5791 S 3260 W
- 5432 S 3150 W
- 5321 S 3100 W
- 2907 W 5775 S
- 5998 S 3100 W
- 5859 S 3500 W
- 3009 W 6000 S
- 2786 W 5550 S Unit C11
- 2778 W 5550 S Unit 28
- 3607 W 5400 S
- 2829 W 5925 S
- 3443 W 5200 S Unit 2&3
- 2672 W 5750 S
- 2657 N 2000 W
- 2647 N 2000 W
- 5645 S 3200 W
- 5645 S 3200 W Unit 21
- 5627 S 3200 W
- 5661 S 3200 W
- 5661 S 3200 W Unit 22
- 3196 W 5625 S Unit 18
- 5632 S 3200 W
- 5677 S 3200 W
- 5677 S 3200 W Unit 23
- 5640 S 3200 W
- 5644 S 3200 W
- 5691 S 3200 W
- 5691 S 3200 W Unit 24
- 5676 S 3200 W
- 5629 S 3150 W
- 5631 S 3150 W
- 5647 S 3150 W
- 5592 S 3200 W
- 5692 S 3200 W
- 5674 S 3150 W