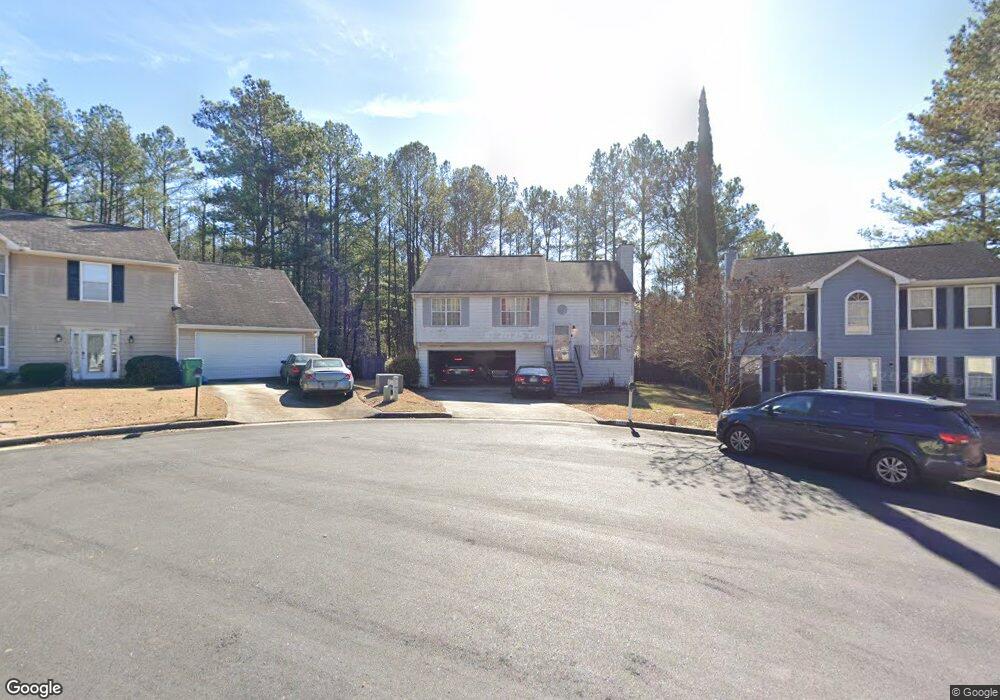
5639 Hunters Crossing Ct Unit /18 Lithonia, GA 30038
Estimated Value: $253,914 - $294,000
4
Beds
3
Baths
2,308
Sq Ft
$116/Sq Ft
Est. Value
About This Home
This home is located at 5639 Hunters Crossing Ct Unit /18, Lithonia, GA 30038 and is currently estimated at $268,229, approximately $116 per square foot. 5639 Hunters Crossing Ct Unit /18 is a home located in DeKalb County with nearby schools including Flat Rock Elementary School, Salem Middle School, and Martin Luther King- Jr. High School.
Ownership History
Date
Name
Owned For
Owner Type
Purchase Details
Closed on
Aug 25, 2025
Sold by
Mcpherson Edgar
Bought by
Mcpherson Tony David
Current Estimated Value
Purchase Details
Closed on
Feb 21, 2014
Sold by
Rucker Albert L
Bought by
Mcpherson Edgar
Home Financials for this Owner
Home Financials are based on the most recent Mortgage that was taken out on this home.
Original Mortgage
$63,900
Outstanding Balance
$48,457
Interest Rate
4.43%
Mortgage Type
New Conventional
Estimated Equity
$219,772
Purchase Details
Closed on
Mar 31, 2003
Sold by
Gardner Donnell D
Bought by
Rucker Albert L
Home Financials for this Owner
Home Financials are based on the most recent Mortgage that was taken out on this home.
Original Mortgage
$128,250
Interest Rate
5.82%
Mortgage Type
New Conventional
Purchase Details
Closed on
Mar 4, 2002
Sold by
Garnder Victor
Bought by
Gardner Donnell
Purchase Details
Closed on
Jul 5, 1995
Sold by
Dawkins Cluff Mr Susan
Bought by
Gardner Donnell
Create a Home Valuation Report for This Property
The Home Valuation Report is an in-depth analysis detailing your home's value as well as a comparison with similar homes in the area
Home Values in the Area
Average Home Value in this Area
Purchase History
| Date | Buyer | Sale Price | Title Company |
|---|---|---|---|
| Mcpherson Tony David | -- | -- | |
| Mcpherson Edgar | $71,000 | -- | |
| Rucker Albert L | $135,000 | -- | |
| Gardner Donnell | -- | -- | |
| Gardner Donnell | $106,000 | -- |
Source: Public Records
Mortgage History
| Date | Status | Borrower | Loan Amount |
|---|---|---|---|
| Open | Mcpherson Edgar | $63,900 | |
| Previous Owner | Rucker Albert L | $128,250 |
Source: Public Records
Tax History Compared to Growth
Tax History
| Year | Tax Paid | Tax Assessment Tax Assessment Total Assessment is a certain percentage of the fair market value that is determined by local assessors to be the total taxable value of land and additions on the property. | Land | Improvement |
|---|---|---|---|---|
| 2025 | $5,103 | $104,160 | $20,000 | $84,160 |
| 2024 | $5,740 | $119,240 | $20,000 | $99,240 |
| 2023 | $5,740 | $102,360 | $8,000 | $94,360 |
| 2022 | $4,461 | $93,840 | $8,000 | $85,840 |
| 2021 | $3,236 | $64,960 | $5,240 | $59,720 |
| 2020 | $2,599 | $51,200 | $5,240 | $45,960 |
| 2019 | $2,466 | $48,520 | $5,240 | $43,280 |
| 2018 | $1,883 | $39,400 | $5,240 | $34,160 |
| 2017 | $1,994 | $37,600 | $5,240 | $32,360 |
| 2016 | $1,906 | $35,520 | $5,240 | $30,280 |
| 2014 | $859 | $26,600 | $5,200 | $21,400 |
Source: Public Records
Map
Nearby Homes
- 3255 Hunters Crossing Point
- 3015 Bonnes Dr
- 3287 Pennington Dr
- 5891 Cassie Dr
- 5536 La Fleur Trail
- 5843 Taka Ln
- 5919 Cassie Dr
- 3147 Bonnes Dr
- 5873 Taka Ln
- 3406 Pennington Dr
- 5614 Regency Forest Ct
- 3248 Brisbane Way
- 5664 Reynard Trail
- 5600 Rock Springs Rd
- 5436 Brisbane Ct Unit 1
- 3340 Fannin Ct
- 5585 Fairington Place
- 3027 Fair Creek Ct
- 5515 Rock Springs Rd
- 5964 Springfair Run
- 5639 Hunters Crossing Ct
- 5643 Hunters Crossing Ct
- 5635 Hunters Crossing Ct
- 5680 Hunters Crossing Ford
- 5664 Hunters Crossing Ford
- 5672 Hunters Crossing Ford
- 5684 Hunters Crossing Ford
- 5684 Hunters Crossing Ford
- 5658 Hunters Crossing Ford
- 5650 Hunters Crossing Ford
- 5644 Hunters Crossing Ct
- 5901 Rock Springs Rd
- 5640 Hunters Crossing Ct
- 5636 Hunters Crossing Ct
- 5687 Hunters Crossing Ford
- 5630 Hunters Crossing Ct
- 5671 Hunters Crossing Ford
- 5675 Hunters Crossing Ford
- 5683 Hunters Crossing Ford
- 5663 Hunters Crossing Ford