Estimated Value: $478,000 - $518,460
2
Beds
2
Baths
2,624
Sq Ft
$192/Sq Ft
Est. Value
About This Home
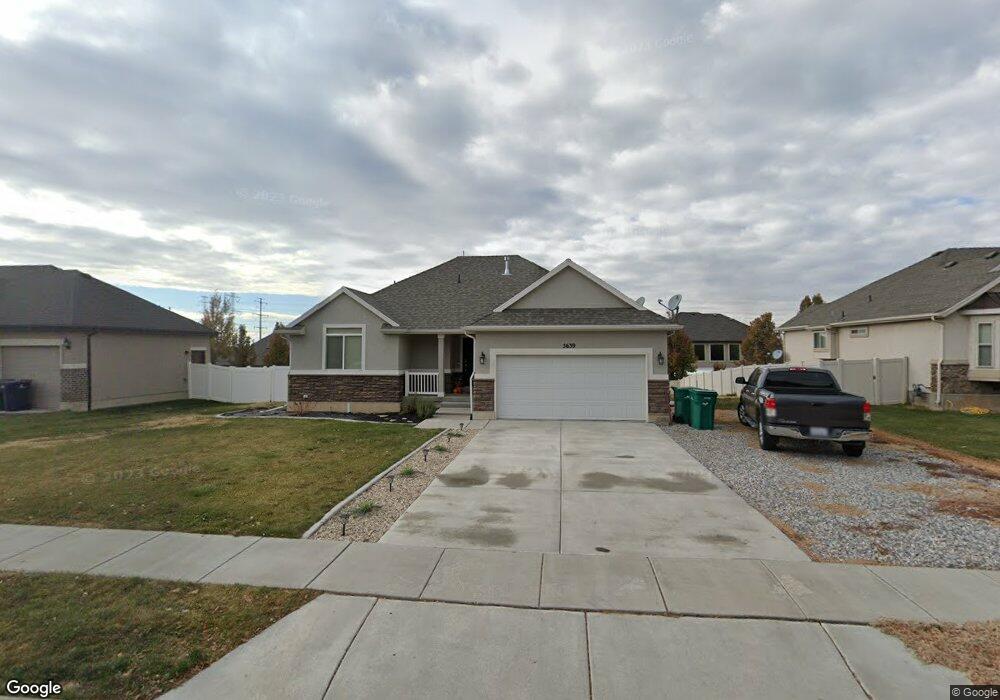
This home is located at 5639 S 3100 W, Roy, UT 84067 and is currently estimated at $505,115, approximately $192 per square foot. 5639 S 3100 W is a home located in Weber County with nearby schools including Roy Elementary School, Roy Junior High School, and Roy High School.
Ownership History
Date
Name
Owned For
Owner Type
Purchase Details
Closed on
Mar 21, 2022
Sold by
Hall Debra D
Bought by
Kammersell Joshua and Toledo Jamie
Current Estimated Value
Home Financials for this Owner
Home Financials are based on the most recent Mortgage that was taken out on this home.
Original Mortgage
$429,250
Outstanding Balance
$402,127
Interest Rate
4.16%
Mortgage Type
New Conventional
Estimated Equity
$102,988
Purchase Details
Closed on
Oct 10, 2013
Sold by
Ivory Homes Ltd
Bought by
Hall Debra D
Home Financials for this Owner
Home Financials are based on the most recent Mortgage that was taken out on this home.
Original Mortgage
$234,671
Interest Rate
4.62%
Mortgage Type
FHA
Purchase Details
Closed on
May 20, 2009
Sold by
Burbs Llc
Bought by
Ivory Homes Ltd
Purchase Details
Closed on
Sep 22, 2008
Sold by
Ivory Development Llc
Bought by
Burbs Llc
Create a Home Valuation Report for This Property
The Home Valuation Report is an in-depth analysis detailing your home's value as well as a comparison with similar homes in the area
Home Values in the Area
Average Home Value in this Area
Purchase History
| Date | Buyer | Sale Price | Title Company |
|---|---|---|---|
| Kammersell Joshua | -- | None Listed On Document | |
| Hall Debra D | -- | Cottonwood Title Ins Ageny | |
| Ivory Homes Ltd | -- | Cottonwood Title Insurance A | |
| Burbs Llc | -- | None Available |
Source: Public Records
Mortgage History
| Date | Status | Borrower | Loan Amount |
|---|---|---|---|
| Open | Kammersell Joshua | $429,250 | |
| Previous Owner | Hall Debra D | $234,671 |
Source: Public Records
Tax History Compared to Growth
Tax History
| Year | Tax Paid | Tax Assessment Tax Assessment Total Assessment is a certain percentage of the fair market value that is determined by local assessors to be the total taxable value of land and additions on the property. | Land | Improvement |
|---|---|---|---|---|
| 2025 | $3,037 | $487,748 | $170,000 | $317,748 |
| 2024 | $2,967 | $263,999 | $93,501 | $170,498 |
| 2023 | $2,948 | $263,450 | $90,696 | $172,754 |
| 2022 | $2,872 | $262,900 | $74,255 | $188,645 |
| 2021 | $2,488 | $376,000 | $90,005 | $285,995 |
| 2020 | $2,323 | $322,000 | $90,005 | $231,995 |
| 2019 | $2,252 | $294,000 | $12,535 | $281,465 |
| 2018 | $2,126 | $261,000 | $55,082 | $205,918 |
| 2017 | $2,157 | $250,000 | $55,082 | $194,918 |
| 2016 | $2,076 | $129,414 | $30,199 | $99,215 |
| 2015 | $1,853 | $117,866 | $32,852 | $85,014 |
| 2014 | $1,722 | $107,450 | $27,427 | $80,023 |
Source: Public Records
Map
Nearby Homes
- 3166 W 5625 S
- 3176 W 5625 S
- 3186 W 5625 S
- 5538 S 3150 W
- 2995 W 5750 S
- 5432 S 3150 W
- 3198 W 5825 S
- 5404 S 3150 W
- 2907 W 5775 S
- 5321 S 3100 W
- 5919 S 3200 W
- 5568 S 2800 W Unit 5B
- 2786 W 5550 S Unit C11
- 5998 S 3100 W
- 2778 W 5400 S
- 2829 W 5925 S
- 5854 S 3500 W
- 2672 W 5750 S
- 5982 S 2825 W
- 2646 W 5625 S Unit M-2646