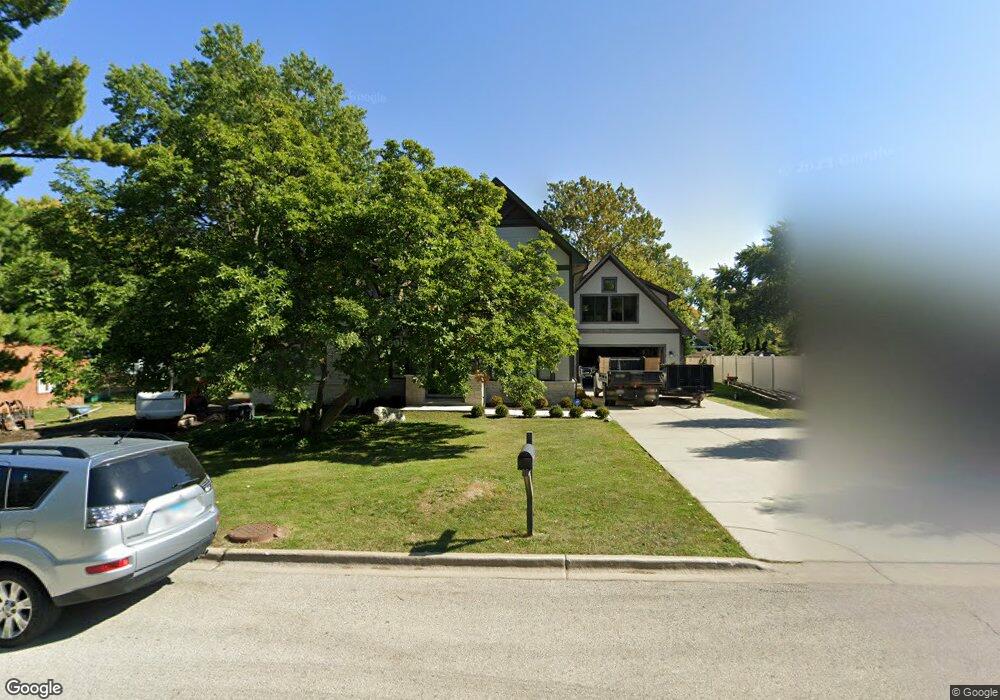
5639 S Peck Ave Countryside, IL 60525
Estimated Value: $522,000 - $607,341
4
Beds
3
Baths
2,452
Sq Ft
$231/Sq Ft
Est. Value
About This Home
This home is located at 5639 S Peck Ave, Countryside, IL 60525 and is currently estimated at $566,335, approximately $230 per square foot. 5639 S Peck Ave is a home located in Cook County with nearby schools including Highlands Elementary School, Highlands Middle School, and Lyons Township High School.
Ownership History
Date
Name
Owned For
Owner Type
Purchase Details
Closed on
Nov 27, 2024
Sold by
Strecker Michael J and Strecker Dennis J
Bought by
Michael J Strecker Revocable Trust and Strecker
Current Estimated Value
Purchase Details
Closed on
Jan 10, 2012
Sold by
Fishman Constance A and Gilmore Caroline Sue
Bought by
Strecker Michael J and Strecker Dennis J
Home Financials for this Owner
Home Financials are based on the most recent Mortgage that was taken out on this home.
Original Mortgage
$135,000
Interest Rate
3.93%
Mortgage Type
New Conventional
Purchase Details
Closed on
Feb 18, 2005
Sold by
Webb Margaret A
Bought by
Webb Margaret A and Fishman Constance A
Purchase Details
Closed on
Jul 24, 2000
Sold by
Hetzel Douglas R and Hetzel Carol A
Bought by
Webb Margaret A
Create a Home Valuation Report for This Property
The Home Valuation Report is an in-depth analysis detailing your home's value as well as a comparison with similar homes in the area
Home Values in the Area
Average Home Value in this Area
Purchase History
| Date | Buyer | Sale Price | Title Company |
|---|---|---|---|
| Michael J Strecker Revocable Trust | -- | None Listed On Document | |
| Strecker Michael J | $180,000 | Attorneys Title Guaranty Fun | |
| Webb Margaret A | -- | -- | |
| Webb Margaret A | $143,500 | -- |
Source: Public Records
Mortgage History
| Date | Status | Borrower | Loan Amount |
|---|---|---|---|
| Previous Owner | Strecker Michael J | $135,000 |
Source: Public Records
Tax History Compared to Growth
Tax History
| Year | Tax Paid | Tax Assessment Tax Assessment Total Assessment is a certain percentage of the fair market value that is determined by local assessors to be the total taxable value of land and additions on the property. | Land | Improvement |
|---|---|---|---|---|
| 2024 | $9,821 | $50,307 | $18,038 | $32,269 |
| 2023 | $10,453 | $50,307 | $18,038 | $32,269 |
| 2022 | $10,453 | $45,649 | $15,685 | $29,964 |
| 2021 | $9,954 | $45,648 | $15,685 | $29,963 |
| 2020 | $5,893 | $28,738 | $15,685 | $13,053 |
| 2019 | $4,768 | $24,111 | $14,116 | $9,995 |
| 2018 | $4,680 | $24,111 | $14,116 | $9,995 |
| 2017 | $4,574 | $24,111 | $14,116 | $9,995 |
| 2016 | $3,981 | $18,827 | $12,548 | $6,279 |
| 2015 | $3,886 | $18,827 | $12,548 | $6,279 |
| 2014 | $3,846 | $18,827 | $12,548 | $6,279 |
| 2013 | $5,486 | $23,748 | $12,548 | $11,200 |
Source: Public Records
Map
Nearby Homes
- 5547 S Peck Ave
- 5736 Willow Springs Rd
- 1316 W 55th St
- 5546 Laurel Ave
- 5727 Howard Ave
- 1720 W 54th Place
- 1392 W 52nd Place
- 5559 Wolf Rd
- 5811 Longview Dr Unit 2
- 1901 W Plainfield Rd
- 1140 S Stone Ave
- 5684 Wolf Rd
- 5314 Franklin Ave
- 5129 Harvey Ave
- 5808 Wolf Rd Unit 3
- 5214 Howard Ave
- 6001 Wolf Rd
- 6220 Sunset Ave
- 1001 S Brainard Ave
- 210 51st Place
- 5647 S Peck Ave
- 5631 S Peck Ave
- 5638 S Peck Ave Unit 3
- 5632 S Peck Ave
- 5625 S Peck Ave
- 5646 S Peck Ave
- 5707 S Peck Ave
- 5624 S Peck Ave
- 5704 S Peck Ave Unit 3
- 5617 S Peck Ave
- 5646 Leitch Ave
- 5632 Leitch Ave
- 5717 S Peck Ave
- 5640 Leitch Ave
- 5706 Leitch Ave
- 5624 Leitch Ave
- 5710 S Peck Ave
- 5616 S Peck Ave
- 5639 Willow Springs Rd
- 5633 Willow Springs Rd