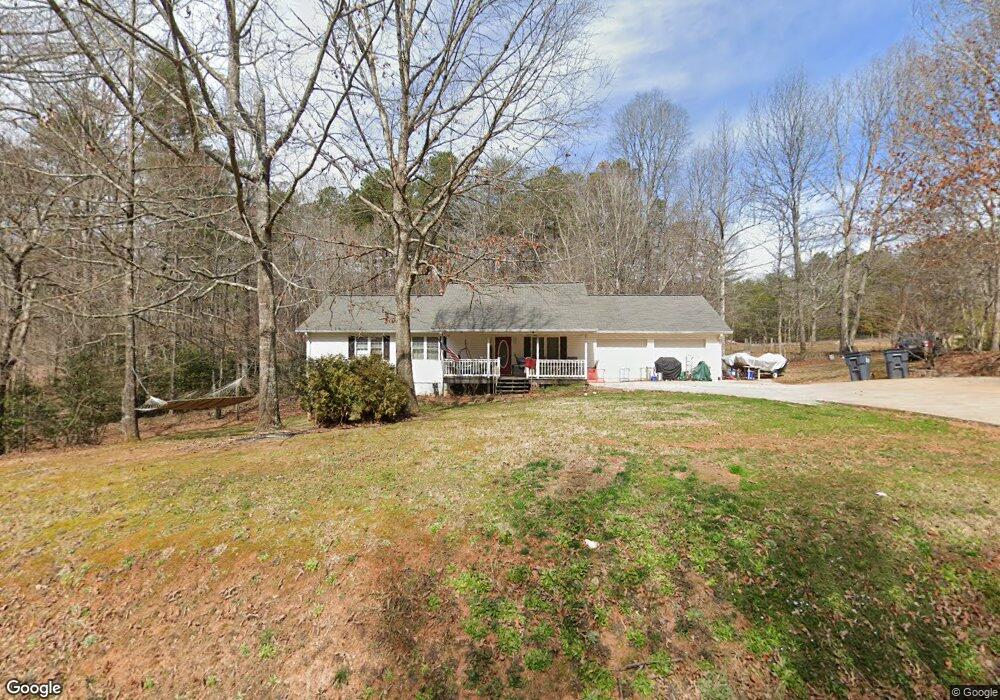
564 Carlton Seitz Rd Dahlonega, GA 30533
Estimated Value: $330,096 - $367,000
--
Bed
2
Baths
1,412
Sq Ft
$248/Sq Ft
Est. Value
About This Home
This home is located at 564 Carlton Seitz Rd, Dahlonega, GA 30533 and is currently estimated at $349,524, approximately $247 per square foot. 564 Carlton Seitz Rd is a home located in Lumpkin County with nearby schools including Lumpkin County High School.
Ownership History
Date
Name
Owned For
Owner Type
Purchase Details
Closed on
Jun 18, 2018
Sold by
Graff Julie
Bought by
Gladick William Paul and Gladick Roxanne M
Current Estimated Value
Home Financials for this Owner
Home Financials are based on the most recent Mortgage that was taken out on this home.
Original Mortgage
$136,000
Outstanding Balance
$117,881
Interest Rate
4.6%
Mortgage Type
New Conventional
Estimated Equity
$231,643
Purchase Details
Closed on
Nov 30, 2012
Sold by
Wilson Clara Blacknall
Bought by
Graff Christopher A
Home Financials for this Owner
Home Financials are based on the most recent Mortgage that was taken out on this home.
Original Mortgage
$160,375
Interest Rate
3.44%
Mortgage Type
VA
Purchase Details
Closed on
Mar 22, 2004
Sold by
Daniell Jason W and Daniell Br
Bought by
Wilson Clara Blacknall
Purchase Details
Closed on
Jul 6, 2000
Sold by
Daniell Roy and Daniell Debby
Bought by
Daniell Jason W and Daniell Br
Create a Home Valuation Report for This Property
The Home Valuation Report is an in-depth analysis detailing your home's value as well as a comparison with similar homes in the area
Home Values in the Area
Average Home Value in this Area
Purchase History
| Date | Buyer | Sale Price | Title Company |
|---|---|---|---|
| Gladick William Paul | $170,000 | -- | |
| Graff Julie | $150,444 | -- | |
| Graff Christopher A | $165,000 | -- | |
| Wilson Clara Blacknall | $155,900 | -- | |
| Daniell Jason W | -- | -- |
Source: Public Records
Mortgage History
| Date | Status | Borrower | Loan Amount |
|---|---|---|---|
| Open | Graff Julie | $136,000 | |
| Closed | Gladick William Paul | $136,000 | |
| Previous Owner | Graff Christopher A | $160,375 |
Source: Public Records
Tax History Compared to Growth
Tax History
| Year | Tax Paid | Tax Assessment Tax Assessment Total Assessment is a certain percentage of the fair market value that is determined by local assessors to be the total taxable value of land and additions on the property. | Land | Improvement |
|---|---|---|---|---|
| 2024 | $2,569 | $108,966 | $11,200 | $97,766 |
| 2023 | $2,289 | $97,316 | $10,000 | $87,316 |
| 2022 | $2,057 | $83,073 | $8,000 | $75,073 |
| 2021 | $1,830 | $71,496 | $8,000 | $63,496 |
| 2020 | $1,845 | $69,926 | $8,000 | $61,926 |
| 2019 | $1,810 | $69,926 | $8,000 | $61,926 |
| 2018 | $1,764 | $62,190 | $8,000 | $54,190 |
| 2017 | $1,741 | $60,178 | $8,000 | $52,178 |
| 2016 | $1,680 | $56,193 | $8,000 | $48,193 |
| 2015 | $1,511 | $56,193 | $8,000 | $48,193 |
| 2014 | $1,511 | $57,326 | $8,000 | $49,326 |
| 2013 | -- | $57,893 | $8,000 | $49,893 |
Source: Public Records
Map
Nearby Homes
- 486 Laurel Cir
- 190 Grand Oak Ln
- 221 Laurel Cir
- 0 Rainmore Dr Unit 7620063
- 0 Rainmore Dr Unit 10570615
- 15 Baker St
- 191 Sleepy Hollow Rd
- 103 Rainmore Dr
- 150 Buck Run E
- 33 Tj Mote Rd
- 33 T J Mote Rd
- 50 Loyal Dr
- 194 Deerfield Dr
- 775 Crooked Creek Dr
- 0 Honey Tree Terrace Unit 10448792
- 0 Honey Tree Terrace Unit 7516071
- 251 Bearslide Hollow
- Lot 5 Still Rd
- 0x Pink Williams Rd
- 0x Pink Williams Rd Unit 124AC
- 26 Cardinal Dr
- 515 Carlton Seitz Rd
- 0 Carlton Seitz Rd Unit 8506434
- 0 Carlton Seitz Rd Unit 3219746
- 0 Carlton Seitz Rd
- 44 Cardinal Dr
- 343 Carlton Seitz Rd
- 75 Etowah Cove Rd
- 477 Carlton Seitz Rd
- 37 N Promise Trail
- 80 Cardinal Dr
- 22 N Promise Trail
- 109 Misty Hollow Dr
- 260 Misty Hollow Dr
- 00 Etowah Cove Rd
- 250 Misty Hollow Dr
- 427 Carlton Seitz Rd
- 89 Cardinal Dr
- 85 Misty Hollow Dr Unit 17
- 85 Misty Hollow Dr