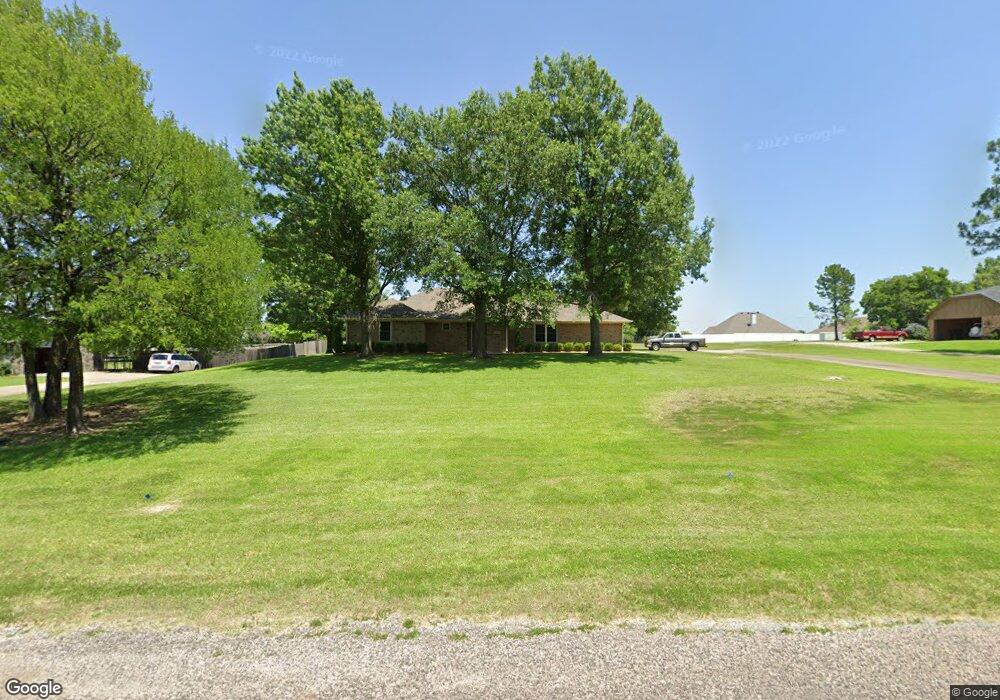
564 Carriage Estates Rd Sherman, TX 75092
Estimated Value: $363,000 - $462,000
--
Bed
--
Bath
2,581
Sq Ft
$163/Sq Ft
Est. Value
About This Home
This home is located at 564 Carriage Estates Rd, Sherman, TX 75092 and is currently estimated at $420,657, approximately $162 per square foot. 564 Carriage Estates Rd is a home located in Grayson County with nearby schools including S&S Consolidated Elementary School, S&S Consolidated Middle School, and S. & S. Cons H.S..
Ownership History
Date
Name
Owned For
Owner Type
Purchase Details
Closed on
Feb 29, 2024
Sold by
Ennes Karen J
Bought by
Frederick Chris and Frederick Betty
Current Estimated Value
Purchase Details
Closed on
Apr 29, 2023
Sold by
Buenrostro Renee L
Bought by
Ennes Karen J
Create a Home Valuation Report for This Property
The Home Valuation Report is an in-depth analysis detailing your home's value as well as a comparison with similar homes in the area
Home Values in the Area
Average Home Value in this Area
Purchase History
| Date | Buyer | Sale Price | Title Company |
|---|---|---|---|
| Frederick Chris | -- | None Listed On Document | |
| Ennes Karen J | -- | None Listed On Document |
Source: Public Records
Tax History Compared to Growth
Tax History
| Year | Tax Paid | Tax Assessment Tax Assessment Total Assessment is a certain percentage of the fair market value that is determined by local assessors to be the total taxable value of land and additions on the property. | Land | Improvement |
|---|---|---|---|---|
| 2025 | $7,889 | $401,267 | $128,502 | $272,765 |
| 2024 | $7,889 | $395,000 | $130,680 | $264,320 |
| 2023 | $4,193 | $348,416 | $0 | $0 |
| 2022 | $6,802 | $316,742 | $0 | $0 |
| 2021 | $6,871 | $287,947 | $58,370 | $229,577 |
| 2020 | $7,102 | $290,395 | $58,370 | $232,025 |
| 2019 | $6,543 | $303,478 | $43,560 | $259,918 |
| 2018 | $5,529 | $261,340 | $19,333 | $242,007 |
| 2017 | $4,985 | $263,630 | $19,333 | $244,297 |
| 2016 | $4,532 | $260,981 | $19,333 | $241,648 |
| 2015 | $2,441 | $175,361 | $19,333 | $156,028 |
| 2014 | $2,557 | $163,784 | $19,333 | $144,451 |
Source: Public Records
Map
Nearby Homes
- 1905 Norwood St
- 2217 Norwood St
- TBD Heritage Knoll -26 Lots
- 1706 Norwood St
- 2202 Carriage Estates Rd
- 2802 Spring Lake Dr
- 1913 Heritage Knoll Dr
- 1912 Heritage Knoll Dr
- 1720 Heritage Knoll Dr
- 2201 Norwood St
- 1813 Drexel Dr
- 2213 Trailside Dr
- 2715 Stonecrest Dr
- 1809 Heritage Creek Dr
- 1605 Heritage Creek Dr
- 2220 Trailside Dr
- 2710 Stonecrest Dr
- 2224 Trailside Dr
- 2228 Trailside Dr
- 2714 Stonecrest Dr
- 1915 Carriage Estates Rd
- 600 Carriage Estates Rd
- 2001 Carriage Estates Rd
- 2001 Carriage Estates Rd
- 536 Carriage Estates Rd
- 465 Norwood Rd
- 1914 Norwood St
- 1903 Carriage Estates Rd
- 622 Carriage Estates Rd Unit A
- 529 Carriage Estates Rd
- 1904 Carriage Estates Rd
- 1904 Carriage Estates Rd
- 502 Carriage Estates Rd Unit A
- 427 Norwood Rd
- 2004 Norwood St
- 1908 Norwood St
- 521 Carriage Estates Rd
- 597 Carriage Estates Rd
- 515 Norwood Rd
- 1813 Carriage Estates Rd