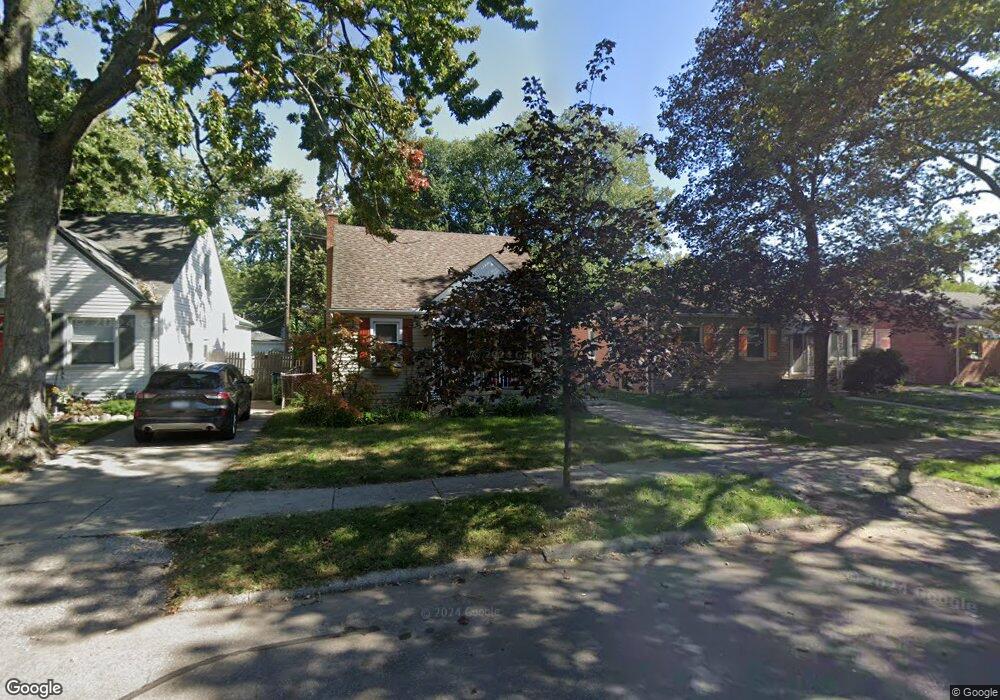
564 Gardendale St Unit Bldg-Unit Ferndale, MI 48220
Estimated Value: $246,000 - $313,000
3
Beds
1
Bath
920
Sq Ft
$289/Sq Ft
Est. Value
About This Home
This home is located at 564 Gardendale St Unit Bldg-Unit, Ferndale, MI 48220 and is currently estimated at $265,578, approximately $288 per square foot. 564 Gardendale St Unit Bldg-Unit is a home located in Oakland County with nearby schools including Ferndale Lower Elementary Campus, Ferndale Upper Elementary Campus, and Ferndale Middle School.
Ownership History
Date
Name
Owned For
Owner Type
Purchase Details
Closed on
Jul 18, 2018
Sold by
Elder Mark
Bought by
Call Claire Renee and Johnson Nicholas Dale
Current Estimated Value
Home Financials for this Owner
Home Financials are based on the most recent Mortgage that was taken out on this home.
Original Mortgage
$161,280
Outstanding Balance
$139,773
Interest Rate
4.5%
Mortgage Type
New Conventional
Estimated Equity
$125,805
Purchase Details
Closed on
Jan 22, 2004
Sold by
Boulier Randy and Sirva Relocation Llc
Bought by
Elder Mark
Home Financials for this Owner
Home Financials are based on the most recent Mortgage that was taken out on this home.
Original Mortgage
$122,400
Interest Rate
4.62%
Mortgage Type
Purchase Money Mortgage
Purchase Details
Closed on
May 29, 1998
Sold by
Chouinard Martin
Bought by
Boulier Randy
Home Financials for this Owner
Home Financials are based on the most recent Mortgage that was taken out on this home.
Original Mortgage
$93,600
Interest Rate
6.8%
Purchase Details
Closed on
Oct 24, 1994
Sold by
Getz Marla A
Bought by
Ghouinard Martin
Create a Home Valuation Report for This Property
The Home Valuation Report is an in-depth analysis detailing your home's value as well as a comparison with similar homes in the area
Home Values in the Area
Average Home Value in this Area
Purchase History
| Date | Buyer | Sale Price | Title Company |
|---|---|---|---|
| Call Claire Renee | $179,200 | None Available | |
| Elder Mark | $153,000 | -- | |
| Boulier Randy | $104,000 | -- | |
| Ghouinard Martin | $42,000 | -- |
Source: Public Records
Mortgage History
| Date | Status | Borrower | Loan Amount |
|---|---|---|---|
| Open | Call Claire Renee | $161,280 | |
| Previous Owner | Elder Mark | $122,400 | |
| Previous Owner | Boulier Randy | $93,600 | |
| Closed | Ghouinard Martin | -- | |
| Closed | Elder Mark | $30,600 |
Source: Public Records
Tax History Compared to Growth
Tax History
| Year | Tax Paid | Tax Assessment Tax Assessment Total Assessment is a certain percentage of the fair market value that is determined by local assessors to be the total taxable value of land and additions on the property. | Land | Improvement |
|---|---|---|---|---|
| 2024 | $3,671 | $96,190 | $0 | $0 |
| 2023 | $3,566 | $91,000 | $0 | $0 |
| 2022 | $3,586 | $83,180 | $0 | $0 |
| 2021 | $3,608 | $73,550 | $0 | $0 |
| 2020 | $3,418 | $69,040 | $0 | $0 |
| 2019 | $3,474 | $61,240 | $0 | $0 |
| 2018 | $2,649 | $52,750 | $0 | $0 |
| 2017 | $2,610 | $52,880 | $0 | $0 |
| 2016 | $2,576 | $48,680 | $0 | $0 |
| 2015 | -- | $45,900 | $0 | $0 |
| 2014 | -- | $38,830 | $0 | $0 |
| 2011 | -- | $36,840 | $0 | $0 |
Source: Public Records
Map
Nearby Homes
- 559 Gardendale St
- 395 Glendale Ln
- 415 Laprairie St
- 695 Livernois St
- 855 Allen St
- 404 Laprairie St
- 228 Kensington Ave
- 210 Saint Louis St
- 918 Saint Louis St
- 378 Fielding St
- 243 Edgewood Place
- 768 Pinecrest Dr
- 20441 Gardendale St
- 20417 Gardendale St
- 2836 Woodstock Dr
- 964 W Marshall St
- 482 W 8 Mile Rd
- 457 W Bennett
- 546 Leroy St
- 295 W Webster St
- 564 Gardendale St
- 574 Gardendale St
- 554 Gardendale St
- 584 Gardendale St
- 544 Gardendale St
- 563 Meadowdale St Unit Bldg-Unit
- 563 Meadowdale St
- 553 Meadowdale St
- 573 Meadowdale St
- 594 Gardendale St
- 583 Meadowdale St
- 534 Gardendale St
- 563 Gardendale St
- 573 Gardendale St
- 593 Meadowdale St
- 545 Meadowdale St
- 604 Gardendale St
- 583 Gardendale St
- 533 Meadowdale St
- 524 Gardendale St