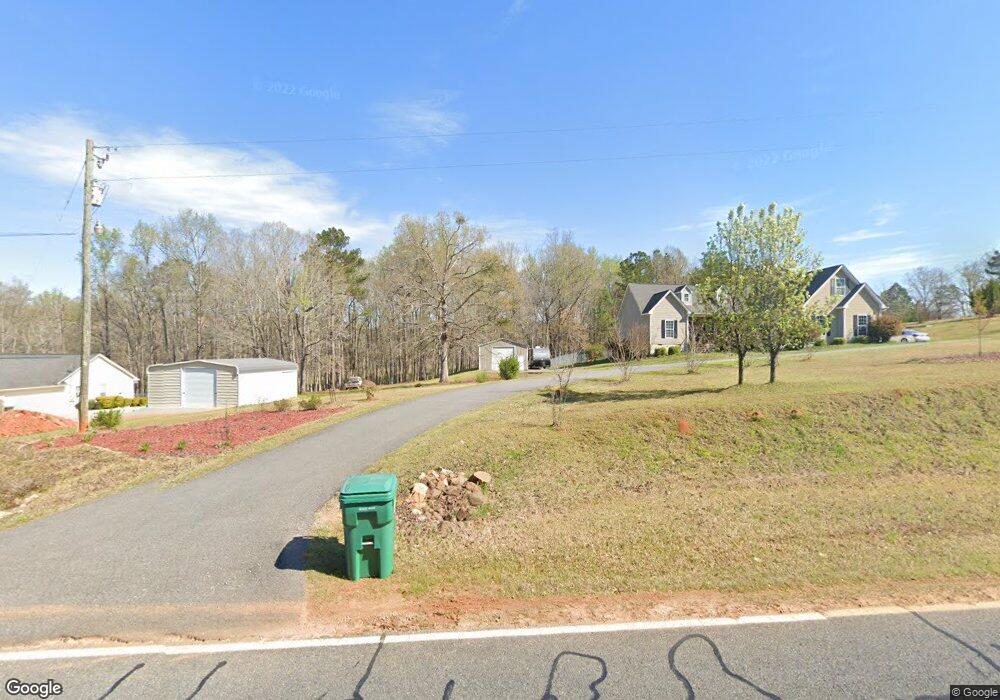
564 Kings Rd SE Milledgeville, GA 31061
Estimated Value: $364,000 - $441,000
3
Beds
1
Bath
2,026
Sq Ft
$195/Sq Ft
Est. Value
About This Home
This home is located at 564 Kings Rd SE, Milledgeville, GA 31061 and is currently estimated at $394,211, approximately $194 per square foot. 564 Kings Rd SE is a home located in Baldwin County with nearby schools including Lakeview Primary, Lakeview Academy, and Oak Hill Middle School.
Ownership History
Date
Name
Owned For
Owner Type
Purchase Details
Closed on
Aug 6, 2021
Sold by
Griffin Charles R
Bought by
Gilbert Kathryn Howard and Gilbert Doy L
Current Estimated Value
Home Financials for this Owner
Home Financials are based on the most recent Mortgage that was taken out on this home.
Original Mortgage
$255,000
Outstanding Balance
$231,874
Interest Rate
2.9%
Mortgage Type
New Conventional
Estimated Equity
$162,337
Purchase Details
Closed on
Sep 8, 2006
Sold by
Cowart Bobby
Bought by
Griffin Charles R and Griffin Debbie A
Home Financials for this Owner
Home Financials are based on the most recent Mortgage that was taken out on this home.
Original Mortgage
$175,000
Interest Rate
6.52%
Mortgage Type
New Conventional
Purchase Details
Closed on
Oct 26, 2005
Sold by
Medlin Darin W
Bought by
Cowart Bobby
Create a Home Valuation Report for This Property
The Home Valuation Report is an in-depth analysis detailing your home's value as well as a comparison with similar homes in the area
Home Values in the Area
Average Home Value in this Area
Purchase History
| Date | Buyer | Sale Price | Title Company |
|---|---|---|---|
| Gilbert Kathryn Howard | $295,000 | -- | |
| Griffin Charles R | $175,000 | -- | |
| Cowart Bobby | $18,000 | -- |
Source: Public Records
Mortgage History
| Date | Status | Borrower | Loan Amount |
|---|---|---|---|
| Open | Gilbert Kathryn Howard | $255,000 | |
| Previous Owner | Griffin Charles R | $175,000 |
Source: Public Records
Tax History Compared to Growth
Tax History
| Year | Tax Paid | Tax Assessment Tax Assessment Total Assessment is a certain percentage of the fair market value that is determined by local assessors to be the total taxable value of land and additions on the property. | Land | Improvement |
|---|---|---|---|---|
| 2025 | $2,797 | $114,776 | $10,320 | $104,456 |
| 2024 | $2,797 | $114,776 | $10,320 | $104,456 |
| 2023 | $2,158 | $88,568 | $8,600 | $79,968 |
| 2022 | $1,966 | $89,652 | $8,600 | $81,052 |
| 2021 | $1,449 | $65,200 | $8,600 | $56,600 |
| 2020 | $1,429 | $65,200 | $8,600 | $56,600 |
| 2019 | $1,432 | $65,200 | $8,600 | $56,600 |
| 2018 | $1,440 | $65,200 | $8,600 | $56,600 |
| 2017 | $1,408 | $65,200 | $8,600 | $56,600 |
| 2016 | $1,456 | $64,120 | $7,160 | $56,960 |
| 2015 | $1,459 | $64,120 | $7,160 | $56,960 |
| 2014 | $1,462 | $64,120 | $7,160 | $56,960 |
Source: Public Records
Map
Nearby Homes
- 560 Kings Rd SE
- 572 Kings Rd SE
- 569 Kings Rd SE
- 571 Kings Rd SE
- 121 Medlin Rd SE
- 115 Medlin Rd SE
- 546 Kings Rd SE
- 584 Kings Rd SE
- 538 Kings Rd SE
- 113 Medlin Rd SE
- 129 Medlin Rd SE
- 125 Medlin Rd SE
- 605 Kings Rd SE
- 134 Medlin Rd SE
- 500 Kings Rd SE Unit 15
- 500 Kings Rd SE
- 111 Medlin Rd SE
- 608 Kings Rd SE
- 130 Medlin Rd SE
- 0 Medlin Rd SE Unit 7223232