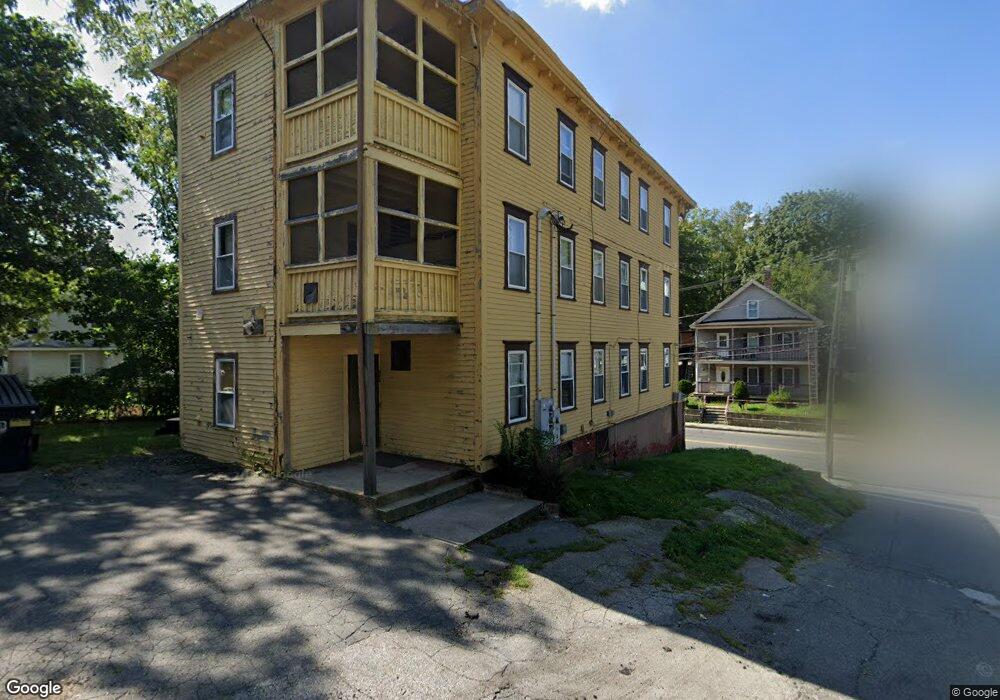
564 Main St Southbridge, MA 01550
Estimated Value: $250,646
9
Beds
3
Baths
5,876
Sq Ft
$43/Sq Ft
Est. Value
About This Home
This home is located at 564 Main St, Southbridge, MA 01550 and is currently estimated at $250,646, approximately $42 per square foot. 564 Main St is a home located in Worcester County with nearby schools including Trinity Catholic Academy and ViewPoint Christian Academy.
Ownership History
Date
Name
Owned For
Owner Type
Purchase Details
Closed on
Aug 23, 2023
Sold by
508 Realty Invs Llc
Bought by
Samia Botros Llc
Current Estimated Value
Home Financials for this Owner
Home Financials are based on the most recent Mortgage that was taken out on this home.
Original Mortgage
$134,400
Interest Rate
6.39%
Mortgage Type
Purchase Money Mortgage
Purchase Details
Closed on
Jun 28, 2023
Sold by
Caplette Peter B
Bought by
508Realty Investments Llc
Home Financials for this Owner
Home Financials are based on the most recent Mortgage that was taken out on this home.
Original Mortgage
$134,400
Interest Rate
6.39%
Mortgage Type
Purchase Money Mortgage
Create a Home Valuation Report for This Property
The Home Valuation Report is an in-depth analysis detailing your home's value as well as a comparison with similar homes in the area
Home Values in the Area
Average Home Value in this Area
Purchase History
| Date | Buyer | Sale Price | Title Company |
|---|---|---|---|
| Samia Botros Llc | $225,000 | None Available | |
| Samia Botros Llc | $225,000 | None Available | |
| Samia Botros Llc | $225,000 | None Available | |
| 508Realty Investments Llc | $168,000 | None Available | |
| 508Realty Investments Llc | $168,000 | None Available | |
| 508Realty Investments Llc | $168,000 | None Available |
Source: Public Records
Mortgage History
| Date | Status | Borrower | Loan Amount |
|---|---|---|---|
| Previous Owner | 508Realty Investments Llc | $134,400 |
Source: Public Records
Tax History Compared to Growth
Tax History
| Year | Tax Paid | Tax Assessment Tax Assessment Total Assessment is a certain percentage of the fair market value that is determined by local assessors to be the total taxable value of land and additions on the property. | Land | Improvement |
|---|---|---|---|---|
| 2025 | $4,454 | $303,800 | $27,300 | $276,500 |
| 2024 | $3,122 | $204,600 | $13,700 | $190,900 |
| 2023 | $2,930 | $185,000 | $13,700 | $171,300 |
| 2022 | $2,885 | $161,200 | $11,700 | $149,500 |
| 2021 | $3,134 | $161,200 | $11,700 | $149,500 |
| 2020 | $3,140 | $161,200 | $11,700 | $149,500 |
| 2018 | $3,123 | $150,500 | $16,900 | $133,600 |
| 2017 | $4,805 | $150,500 | $16,900 | $133,600 |
| 2016 | $3,042 | $150,500 | $16,900 | $133,600 |
| 2015 | $2,936 | $144,200 | $18,200 | $126,000 |
| 2014 | $2,832 | $144,200 | $18,200 | $126,000 |
Source: Public Records
Map
Nearby Homes