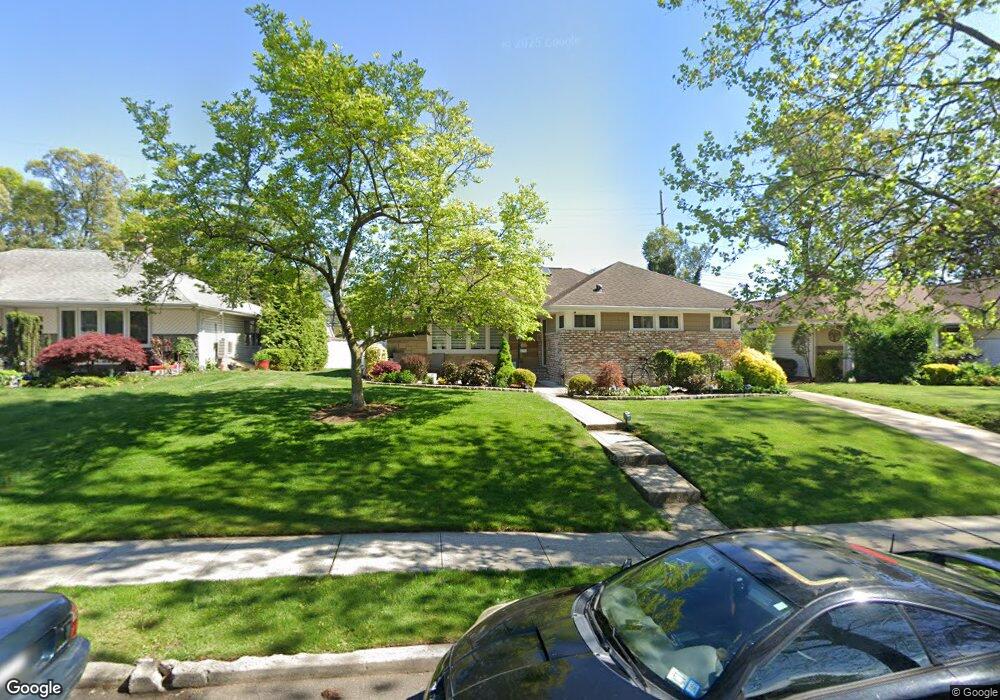
564 Mohawk Rd West Hempstead, NY 11552
Estimated Value: $760,102 - $781,000
3
Beds
2
Baths
1,828
Sq Ft
$422/Sq Ft
Est. Value
About This Home
This home is located at 564 Mohawk Rd, West Hempstead, NY 11552 and is currently estimated at $770,551, approximately $421 per square foot. 564 Mohawk Rd is a home located in Nassau County with nearby schools including Chestnut Street School, West Hempstead Middle School, and West Hempstead Secondary School.
Ownership History
Date
Name
Owned For
Owner Type
Purchase Details
Closed on
Sep 29, 2015
Sold by
Calman Eileen A and Weinman Eileen
Bought by
Rodriguez Jose E and Rodriguez Deyanira
Current Estimated Value
Home Financials for this Owner
Home Financials are based on the most recent Mortgage that was taken out on this home.
Original Mortgage
$354,150
Outstanding Balance
$275,565
Interest Rate
3.88%
Mortgage Type
New Conventional
Estimated Equity
$494,986
Create a Home Valuation Report for This Property
The Home Valuation Report is an in-depth analysis detailing your home's value as well as a comparison with similar homes in the area
Home Values in the Area
Average Home Value in this Area
Purchase History
| Date | Buyer | Sale Price | Title Company |
|---|---|---|---|
| Rodriguez Jose E | $419,000 | The Security Title |
Source: Public Records
Mortgage History
| Date | Status | Borrower | Loan Amount |
|---|---|---|---|
| Open | Rodriguez Jose E | $354,150 |
Source: Public Records
Tax History
| Year | Tax Paid | Tax Assessment Tax Assessment Total Assessment is a certain percentage of the fair market value that is determined by local assessors to be the total taxable value of land and additions on the property. | Land | Improvement |
|---|---|---|---|---|
| 2025 | $12,575 | $457 | $207 | $250 |
| 2024 | $3,684 | $457 | $207 | $250 |
| 2023 | $11,777 | $457 | $207 | $250 |
| 2022 | $11,777 | $457 | $207 | $250 |
| 2021 | $15,434 | $437 | $198 | $239 |
| 2020 | $10,911 | $550 | $434 | $116 |
| 2019 | $10,186 | $540 | $434 | $106 |
| 2018 | $9,430 | $540 | $0 | $0 |
| 2017 | $5,687 | $540 | $410 | $130 |
| 2016 | $8,289 | $571 | $320 | $251 |
| 2015 | $2,701 | $603 | $338 | $265 |
| 2014 | $2,701 | $603 | $338 | $265 |
| 2013 | $3,248 | $774 | $434 | $340 |
Source: Public Records
Map
Nearby Homes
- 947 Glenwood Rd
- 495 Rose Ave
- 815 Iris Place
- 1010 Hempstead Ave
- 450 Rhodes Ln
- 853 Arthur St
- 824 Lawrence Ct
- 846 Harrison St
- 837 Cleveland St
- 771 Maple Place
- 945 Derrick Adkins Ln
- 485 Barbara Ln
- 618 Wall St
- 841 Woodfield Rd
- 486 Champlain Ave
- 15 Seeley Ct
- 734 Berry Ct
- 1024 Mahopac Rd
- 7 Hopatcong Ave
- 480 Hopatcong Ave
Your Personal Tour Guide
Ask me questions while you tour the home.