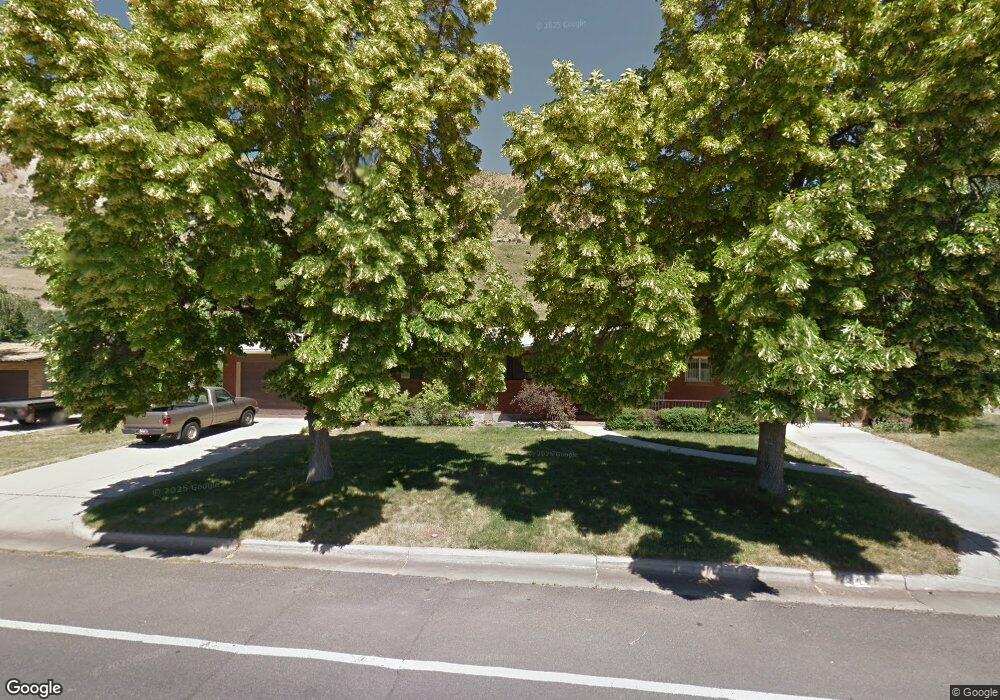
564 N 600 E Brigham City, UT 84302
Estimated Value: $414,864 - $442,000
Studio
--
Bath
1,475
Sq Ft
$290/Sq Ft
Est. Value
About This Home
This home is located at 564 N 600 E, Brigham City, UT 84302 and is currently estimated at $427,466, approximately $289 per square foot. 564 N 600 E is a home located in Box Elder County with nearby schools including Golden Spike Elementary, Box Elder Middle School, and Adele C. Young Intermediate School.
Ownership History
Date
Name
Owned For
Owner Type
Purchase Details
Closed on
Jul 28, 2017
Sold by
Poulsen Christine H and Poulsen Kent R
Bought by
Fernelius James Brian
Current Estimated Value
Home Financials for this Owner
Home Financials are based on the most recent Mortgage that was taken out on this home.
Original Mortgage
$125,681
Outstanding Balance
$105,681
Interest Rate
4.25%
Mortgage Type
FHA
Estimated Equity
$321,785
Purchase Details
Closed on
Nov 2, 2015
Sold by
Jensen Steven O
Bought by
Poulsen Christine H and Poulsen Kent R
Purchase Details
Closed on
Jun 11, 2015
Sold by
Jensen Steven O
Bought by
Poulsen Christine H and Poulsen Kent R
Home Financials for this Owner
Home Financials are based on the most recent Mortgage that was taken out on this home.
Original Mortgage
$6,833
Interest Rate
3.64%
Mortgage Type
Stand Alone Second
Purchase Details
Closed on
Jun 9, 2011
Sold by
Jensen Glen P
Bought by
Jensen Glen Porter and The Glen Porter Jensen Revocable Trust
Create a Home Valuation Report for This Property
The Home Valuation Report is an in-depth analysis detailing your home's value as well as a comparison with similar homes in the area
Purchase History
| Date | Buyer | Sale Price | Title Company |
|---|---|---|---|
| Fernelius James Brian | -- | First American Title Insuran | |
| Poulsen Christine H | -- | American Secure Title Logan | |
| Poulsen Christine H | -- | Amer Secure Title St George | |
| Jensen Glen Porter | -- | None Available |
Source: Public Records
Mortgage History
| Date | Status | Borrower | Loan Amount |
|---|---|---|---|
| Open | Fernelius James Brian | $125,681 | |
| Previous Owner | Poulsen Christine H | $6,833 |
Source: Public Records
Tax History
| Year | Tax Paid | Tax Assessment Tax Assessment Total Assessment is a certain percentage of the fair market value that is determined by local assessors to be the total taxable value of land and additions on the property. | Land | Improvement |
|---|---|---|---|---|
| 2025 | $2,457 | $422,472 | $105,000 | $317,472 |
| 2024 | $2,151 | $414,039 | $100,000 | $314,039 |
| 2023 | $2,233 | $440,175 | $95,000 | $345,175 |
| 2022 | $2,284 | $230,167 | $22,000 | $208,167 |
| 2021 | $1,843 | $257,248 | $40,000 | $217,248 |
| 2020 | $1,583 | $257,248 | $40,000 | $217,248 |
| 2019 | $1,478 | $127,740 | $22,000 | $105,740 |
| 2018 | $1,326 | $113,948 | $22,000 | $91,948 |
| 2017 | $1,192 | $177,451 | $16,500 | $147,451 |
| 2016 | $1,246 | $93,737 | $16,500 | $77,237 |
| 2015 | $1,150 | $86,715 | $16,500 | $70,215 |
| 2014 | $1,150 | $83,371 | $16,500 | $66,871 |
| 2013 | -- | $83,371 | $16,500 | $66,871 |
Source: Public Records
Map
Nearby Homes
- 736 Sunset Dr
- 607 Holiday Dr
- 734 Fairview Dr
- 621 N 300 E
- 801 Medoland Dr
- 728 N Highland Blvd
- 408 N 200 E
- 410 N Main St Unit 15
- 1066 Beecher Ave
- 507 N 200 W
- 225 N Main St
- 287 W 750 N
- 976 N 200 W Unit V333
- 988 N 200 W Unit V336
- 965 N 200 W Unit U330
- 968 N 200 W Unit V331
- 972 N 200 W Unit V332
- 81 W 925 N
- 1228 Sheri Cir
- 682 N 300 W
Your Personal Tour Guide
Ask me questions while you tour the home.