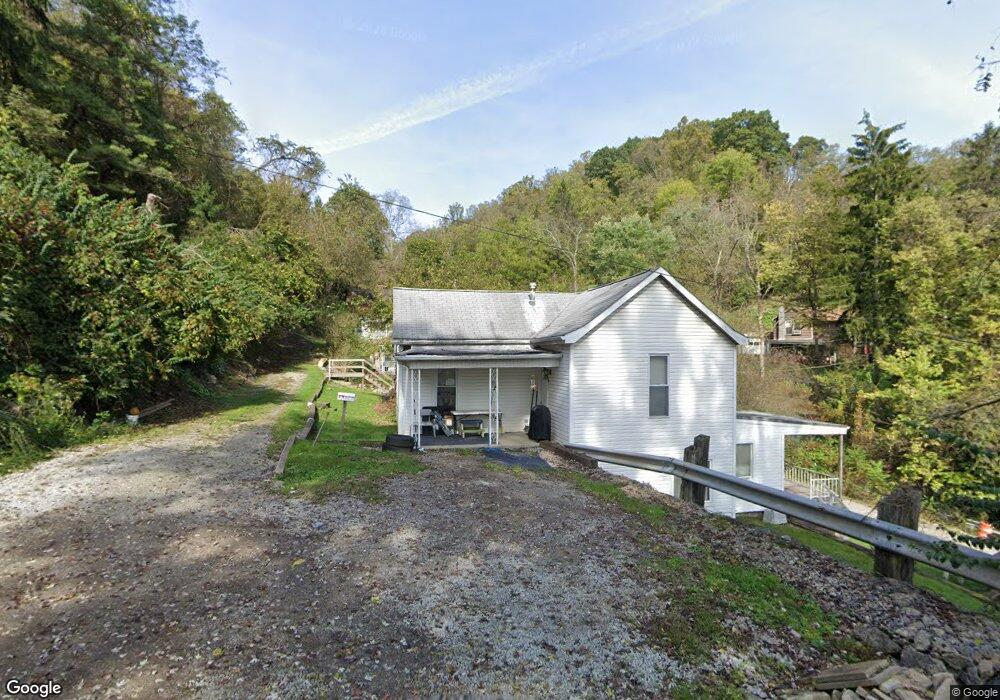
564 N 8th St Martins Ferry, OH 43935
Estimated Value: $47,000 - $69,384
4
Beds
2
Baths
1,117
Sq Ft
$54/Sq Ft
Est. Value
About This Home
This home is located at 564 N 8th St, Martins Ferry, OH 43935 and is currently estimated at $60,096, approximately $53 per square foot. 564 N 8th St is a home located in Belmont County with nearby schools including Anna Marie Ayers Elementary School, Martins Ferry Middle School, and Martins Ferry High School.
Ownership History
Date
Name
Owned For
Owner Type
Purchase Details
Closed on
Mar 14, 2018
Sold by
Jameson Robert
Bought by
Tanner Alisha and Tanner Bryan
Current Estimated Value
Purchase Details
Closed on
Apr 24, 2008
Sold by
Caprita & Sons Inc
Bought by
Jameson Robert
Purchase Details
Closed on
Feb 15, 2006
Sold by
National City Bank
Bought by
Caprita & Sons Inc
Purchase Details
Closed on
Aug 27, 1999
Sold by
Papp Raymond A
Bought by
Papp Raymond A
Purchase Details
Closed on
Jan 1, 1986
Sold by
Deitch Mary Elizabeth
Bought by
Deitch Mary Elizabeth
Create a Home Valuation Report for This Property
The Home Valuation Report is an in-depth analysis detailing your home's value as well as a comparison with similar homes in the area
Home Values in the Area
Average Home Value in this Area
Purchase History
| Date | Buyer | Sale Price | Title Company |
|---|---|---|---|
| Tanner Alisha | $7,000 | None Available | |
| Jameson Robert | $20,000 | Attorney | |
| Caprita & Sons Inc | $7,500 | Accutitle Agency Inc | |
| Papp Raymond A | $20,000 | -- | |
| Deitch Mary Elizabeth | -- | -- |
Source: Public Records
Mortgage History
| Date | Status | Borrower | Loan Amount |
|---|---|---|---|
| Closed | Tanner Alisha | $0 |
Source: Public Records
Tax History Compared to Growth
Tax History
| Year | Tax Paid | Tax Assessment Tax Assessment Total Assessment is a certain percentage of the fair market value that is determined by local assessors to be the total taxable value of land and additions on the property. | Land | Improvement |
|---|---|---|---|---|
| 2024 | $803 | $12,830 | $1,610 | $11,220 |
| 2023 | $1,088 | $9,030 | $1,320 | $7,710 |
| 2022 | $1,119 | $9,034 | $1,320 | $7,714 |
| 2021 | $2,561 | $9,034 | $1,320 | $7,714 |
| 2020 | $1,241 | $7,900 | $1,150 | $6,750 |
| 2019 | $1,729 | $7,900 | $1,150 | $6,750 |
| 2018 | $366 | $7,900 | $1,150 | $6,750 |
| 2017 | $299 | $6,230 | $700 | $5,530 |
| 2016 | $304 | $6,230 | $700 | $5,530 |
| 2015 | $274 | $6,230 | $700 | $5,530 |
| 2014 | $355 | $8,010 | $640 | $7,370 |
| 2013 | $329 | $8,010 | $640 | $7,370 |
Source: Public Records
Map
Nearby Homes