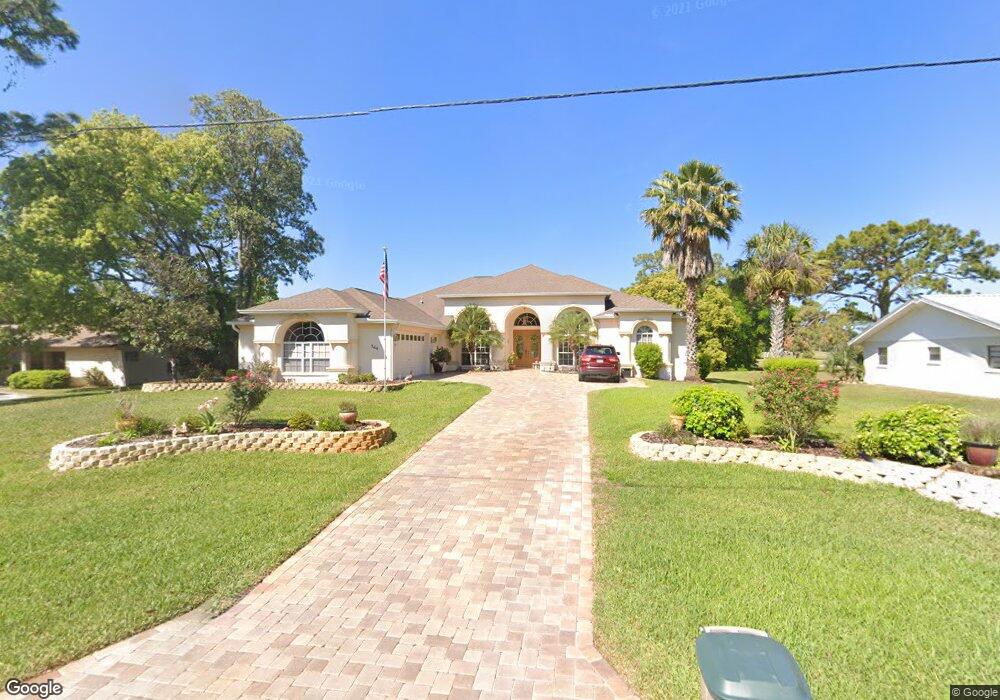
564 N Afterglow Cir Crystal River, FL 34429
Estimated Value: $367,000 - $534,410
4
Beds
4
Baths
2,860
Sq Ft
$155/Sq Ft
Est. Value
About This Home
This home is located at 564 N Afterglow Cir, Crystal River, FL 34429 and is currently estimated at $444,603, approximately $155 per square foot. 564 N Afterglow Cir is a home located in Citrus County with nearby schools including Crystal River Primary School, Crystal River High School, and Crystal River Middle School.
Ownership History
Date
Name
Owned For
Owner Type
Purchase Details
Closed on
Nov 6, 2018
Sold by
Vivienne Robert D and Walsh Vivenne
Bought by
Walsh Robert D and Walsh Vivienne L
Current Estimated Value
Purchase Details
Closed on
Feb 4, 2018
Sold by
Walsh Robert D and Walsh Vinienne
Bought by
Walsh Robert D and Walsh Vivienne L
Purchase Details
Closed on
May 7, 2004
Sold by
Walsh Vivienne and Vivienne Walsh Living Trust
Bought by
Walsh Robert D and Walsh Vivienne
Home Financials for this Owner
Home Financials are based on the most recent Mortgage that was taken out on this home.
Original Mortgage
$174,000
Interest Rate
5.77%
Mortgage Type
Construction
Purchase Details
Closed on
Mar 3, 2004
Sold by
Babcock James R
Bought by
Walsh Vivienne and The Vivienne Walsh Living Trus
Purchase Details
Closed on
Mar 1, 1991
Bought by
Walsh Robert and Walsh Vivienne
Purchase Details
Closed on
May 1, 1983
Bought by
Walsh Robert and Walsh Vivienne
Create a Home Valuation Report for This Property
The Home Valuation Report is an in-depth analysis detailing your home's value as well as a comparison with similar homes in the area
Home Values in the Area
Average Home Value in this Area
Purchase History
| Date | Buyer | Sale Price | Title Company |
|---|---|---|---|
| Walsh Robert D | -- | Attorney | |
| Walsh Robert D | -- | Attorney | |
| Walsh Robert D | -- | Clear Title Of Hernando Inc | |
| Walsh Vivienne | $26,000 | Southeast Title Ins Agency | |
| Walsh Robert | $100 | -- | |
| Walsh Robert | $13,000 | -- |
Source: Public Records
Mortgage History
| Date | Status | Borrower | Loan Amount |
|---|---|---|---|
| Previous Owner | Walsh Robert D | $174,000 |
Source: Public Records
Tax History Compared to Growth
Tax History
| Year | Tax Paid | Tax Assessment Tax Assessment Total Assessment is a certain percentage of the fair market value that is determined by local assessors to be the total taxable value of land and additions on the property. | Land | Improvement |
|---|---|---|---|---|
| 2024 | $2,902 | $227,561 | -- | -- |
| 2023 | $2,902 | $220,933 | $0 | $0 |
| 2022 | $2,717 | $214,498 | $0 | $0 |
| 2021 | $2,886 | $208,250 | $0 | $0 |
| 2020 | $2,788 | $261,411 | $15,000 | $246,411 |
| 2019 | $2,757 | $264,529 | $15,000 | $249,529 |
| 2018 | $2,732 | $250,162 | $21,250 | $228,912 |
| 2017 | $2,726 | $192,963 | $21,250 | $171,713 |
| 2016 | $2,758 | $188,994 | $24,740 | $164,254 |
| 2015 | $2,796 | $187,680 | $24,700 | $162,980 |
| 2014 | $2,853 | $186,190 | $22,250 | $163,940 |
Source: Public Records
Map
Nearby Homes
- 534 N Country Club Dr
- 497 N Afterglow Cir
- 491 N Country Club Dr
- 685 N Afterglow Cir
- 721 N Country Club Dr
- 801 N Country Club Dr
- 818 N Country Club Dr
- 819 N Country Club Dr
- 34 N Country Club Dr
- 25 N Country Club Dr
- 916 N Valley Forge Point
- 84 N Country Club Dr
- 1040 N Fan Palm Point
- 1027 N Country Club Dr Unit 7
- 323 & 325 N Lochview Terrace
- 1050 N Midiron Point
- 9679 W Pimpernel Ln
- 795 N Appalachian Terrace
- 78 S Hibiscus Ave
- 9766 W Smokey Ln
- 580 N Afterglow Cir
- 522 N Afterglow Cir
- 575 N Afterglow Cir
- 725 N Afterglow Cir
- 535 N Afterglow Cir
- 600 N Afterglow Cir
- 517 N Afterglow Cir
- 620 N Afterglow Cir
- 510 N Afterglow Cir
- 615 N Afterglow Cir
- 550 N Country Club Dr
- 496 N Afterglow Cir
- 635 N Afterglow Cir
- 570 N Country Club Dr
- 640 N Afterglow Cir
- 590 N Country Club Dr
- 610 N Country Club Dr
- 516 N Country Club Dr
- 655 N Afterglow Cir
- 630 N Country Club Dr