564 N Lee St Forsyth, GA 31029
Estimated Value: $81,000 - $171,000
2
Beds
1
Bath
960
Sq Ft
$135/Sq Ft
Est. Value
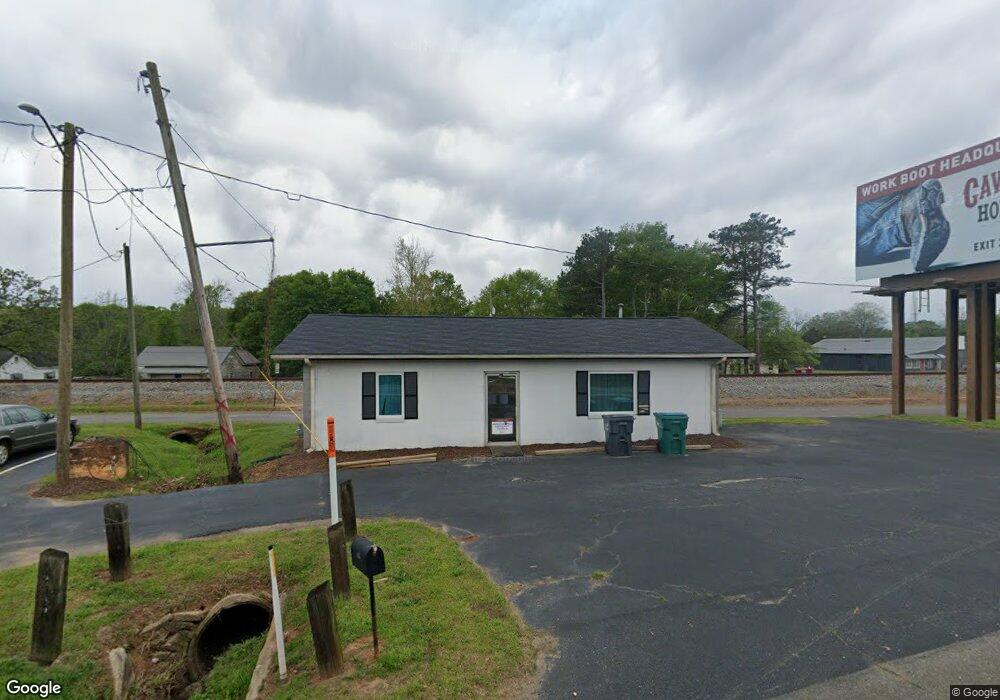
About This Home
This home is located at 564 N Lee St, Forsyth, GA 31029 and is currently estimated at $129,366, approximately $134 per square foot. 564 N Lee St is a home located in Monroe County with nearby schools including Samuel E. Hubbard Elementary School, Mary Persons High School, and Lighthouse Academy.
Ownership History
Date
Name
Owned For
Owner Type
Purchase Details
Closed on
Sep 14, 2016
Sold by
J Wesley Woody Llc
Bought by
North Lee Street Properties Ll
Current Estimated Value
Home Financials for this Owner
Home Financials are based on the most recent Mortgage that was taken out on this home.
Original Mortgage
$165,000
Outstanding Balance
$131,796
Interest Rate
3.43%
Mortgage Type
New Conventional
Estimated Equity
-$2,430
Purchase Details
Closed on
Jul 1, 2013
Sold by
Ellison Lyvonne Bowen
Bought by
J Wesley Woody Llc
Home Financials for this Owner
Home Financials are based on the most recent Mortgage that was taken out on this home.
Original Mortgage
$70,000
Interest Rate
3.91%
Mortgage Type
New Conventional
Purchase Details
Closed on
Apr 23, 1975
Sold by
Hubbard Julian W and Hubbard Barbara
Bought by
Crutchfield Geneva S
Create a Home Valuation Report for This Property
The Home Valuation Report is an in-depth analysis detailing your home's value as well as a comparison with similar homes in the area
Home Values in the Area
Average Home Value in this Area
Purchase History
| Date | Buyer | Sale Price | Title Company |
|---|---|---|---|
| North Lee Street Properties Ll | $165,000 | -- | |
| J Wesley Woody Llc | $95,000 | -- | |
| Crutchfield Geneva S | $16,800 | -- |
Source: Public Records
Mortgage History
| Date | Status | Borrower | Loan Amount |
|---|---|---|---|
| Open | North Lee Street Properties Ll | $165,000 | |
| Previous Owner | J Wesley Woody Llc | $70,000 |
Source: Public Records
Tax History Compared to Growth
Tax History
| Year | Tax Paid | Tax Assessment Tax Assessment Total Assessment is a certain percentage of the fair market value that is determined by local assessors to be the total taxable value of land and additions on the property. | Land | Improvement |
|---|---|---|---|---|
| 2024 | $494 | $16,400 | $3,560 | $12,840 |
| 2023 | $476 | $14,720 | $3,560 | $11,160 |
| 2022 | $435 | $14,720 | $3,560 | $11,160 |
| 2021 | $449 | $14,720 | $3,560 | $11,160 |
| 2020 | $467 | $14,720 | $3,560 | $11,160 |
| 2019 | $470 | $14,720 | $3,560 | $11,160 |
| 2018 | $472 | $14,720 | $3,560 | $11,160 |
| 2017 | $472 | $14,720 | $3,560 | $11,160 |
| 2016 | $473 | $15,440 | $3,560 | $11,880 |
| 2015 | $451 | $15,440 | $3,560 | $11,880 |
| 2014 | $334 | $12,640 | $3,560 | $9,080 |
Source: Public Records
Map
Nearby Homes
- 47 Ensign Rd
- 3487 Georgia 42
- 3271 Georgia 42
- 3471 Georgia 42
- 81 Langston Ave
- 225 N Indian Springs Dr
- 24 George St
- 200 Indian Springs Dr
- 397 Ensign Rd
- 84 Hillsdale Rd
- 205 Solomon St
- 333 W Main St
- 4631 Capulet Ct Unit 331
- 4631 Capulet Ct
- 4616 Capulet Ct
- 5407 Felles Way Unit 356
- 5399 Felles Way Unit 358
- 5399 Felles Way
- 5393 Felles Way Unit 359
- 5387 Felles Way
- 564 N Lee St
- 560 N Lee St
- 510 N Lee St
- 550 N Lee St
- 544 Indian Springs Dr
- 526 Indian Springs Dr
- 520 Indian Springs Dr
- 532 N Lee St
- 477 N Indian Springs Dr
- 317 N Frontage Rd
- 317 N Frontage Rd Unit 1
- 594 Indian Springs Dr
- 51 N Lee St
- 490 Indian Springs Dr
- 00 State Route 42 Unit 104
- 305 N Frontage Rd Unit 2
- 305 N Frontage Rd
- 500 N Lee St
- 44 Oakridge Dr