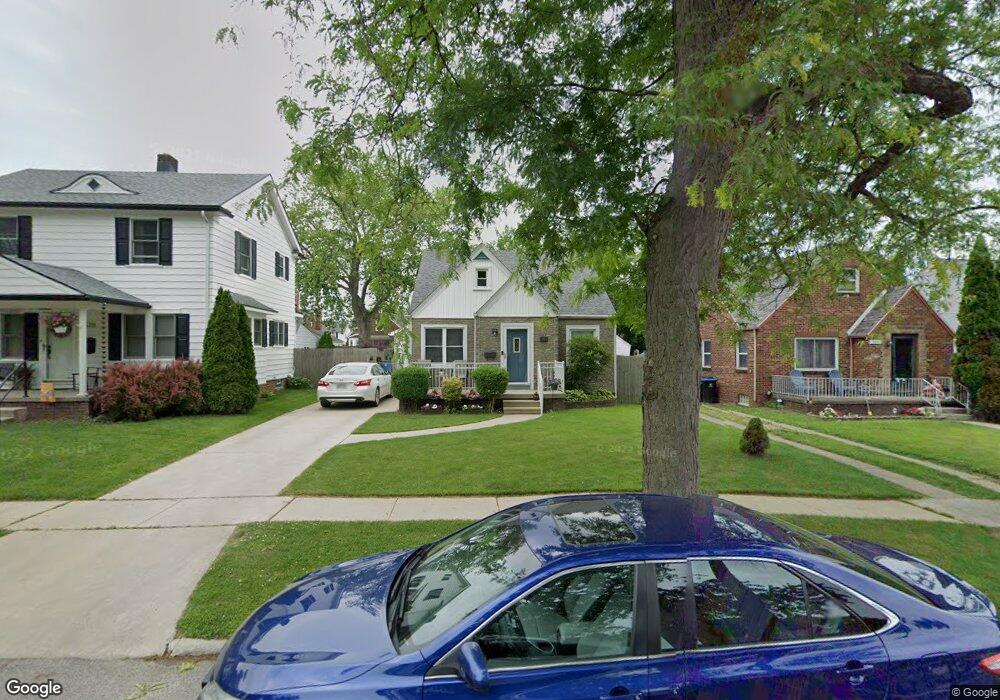
564 Robindale Ave Oregon, OH 43616
Estimated Value: $203,486 - $208,000
3
Beds
2
Baths
1,451
Sq Ft
$142/Sq Ft
Est. Value
About This Home
This home is located at 564 Robindale Ave, Oregon, OH 43616 and is currently estimated at $205,872, approximately $141 per square foot. 564 Robindale Ave is a home located in Lucas County with nearby schools including First St. John Day School, Kateri Catholic Academy, and St. Kateri Catholic Schools.
Ownership History
Date
Name
Owned For
Owner Type
Purchase Details
Closed on
Aug 15, 2002
Sold by
Krieger Benjamin W and Krieger Cynthia J
Bought by
Church Harvey D and Church Stacie L
Current Estimated Value
Home Financials for this Owner
Home Financials are based on the most recent Mortgage that was taken out on this home.
Original Mortgage
$103,600
Outstanding Balance
$42,852
Interest Rate
6.64%
Estimated Equity
$163,020
Purchase Details
Closed on
Aug 31, 1998
Sold by
Pratt Donald P and Pratt Victoria M
Bought by
Krieger Benjamin W and Krieger Cynthia J
Home Financials for this Owner
Home Financials are based on the most recent Mortgage that was taken out on this home.
Original Mortgage
$84,600
Interest Rate
7.03%
Purchase Details
Closed on
Apr 11, 1994
Sold by
Savage Rita M
Purchase Details
Closed on
Apr 16, 1990
Sold by
Savage William Howard
Purchase Details
Closed on
Mar 2, 1988
Sold by
Savage Savage W W and Savage Rita M
Create a Home Valuation Report for This Property
The Home Valuation Report is an in-depth analysis detailing your home's value as well as a comparison with similar homes in the area
Home Values in the Area
Average Home Value in this Area
Purchase History
| Date | Buyer | Sale Price | Title Company |
|---|---|---|---|
| Church Harvey D | $122,500 | -- | |
| Krieger Benjamin W | $94,000 | Midland | |
| -- | $80,500 | -- | |
| -- | -- | -- | |
| -- | -- | -- |
Source: Public Records
Mortgage History
| Date | Status | Borrower | Loan Amount |
|---|---|---|---|
| Open | Church Harvey D | $103,600 | |
| Previous Owner | Krieger Benjamin W | $84,600 |
Source: Public Records
Tax History
| Year | Tax Paid | Tax Assessment Tax Assessment Total Assessment is a certain percentage of the fair market value that is determined by local assessors to be the total taxable value of land and additions on the property. | Land | Improvement |
|---|---|---|---|---|
| 2025 | -- | $49,070 | $9,380 | $39,690 |
| 2024 | $1,201 | $49,070 | $9,380 | $39,690 |
| 2023 | $2,147 | $37,240 | $8,225 | $29,015 |
| 2022 | $2,161 | $37,240 | $8,225 | $29,015 |
| 2021 | $2,178 | $37,240 | $8,225 | $29,015 |
| 2020 | $2,166 | $32,935 | $7,035 | $25,900 |
| 2019 | $2,107 | $32,935 | $7,035 | $25,900 |
| 2018 | $2,188 | $32,935 | $7,035 | $25,900 |
| 2017 | $2,217 | $32,550 | $7,385 | $25,165 |
| 2016 | $2,189 | $93,000 | $21,100 | $71,900 |
| 2015 | $2,277 | $93,000 | $21,100 | $71,900 |
| 2014 | $1,999 | $31,930 | $7,250 | $24,680 |
| 2013 | $1,999 | $31,930 | $7,250 | $24,680 |
Source: Public Records
Map
Nearby Homes
- 674 Sylvandale Ave
- 2649 Luverne Ave
- 2121 Nevada St
- 932 Cresceus Rd
- 2247 Marcy St
- 577 Dover Place
- 2719 Northvale Dr
- 509 Dover Place
- 2809 Starr Ave
- 2716 Hayden St
- 2074 Price St
- 755 Dearborn Ave
- 343 Heffner St
- 558 Thurston St
- 331 Heffner St
- 1940 Hurd St
- 2249 Pickle Rd
- 1943 Starr Ave
- 1912 Greenwood Ave
- 2329 Seaman St
- 560 Robindale Ave
- 570 Robindale Ave
- 556 Robindale Ave
- 2435 Eastvale Ave
- 581 Sylvandale Ave
- 585 Sylvandale Ave
- 573 Sylvandale Ave
- 552 Robindale Ave
- 591 Sylvandale Ave
- 561 Robindale Ave
- 569 Sylvandale Ave
- 565 Robindale Ave
- 548 Robindale Ave
- 571 Robindale Ave
- 595 Sylvandale Ave
- 557 Robindale Ave
- 2455 Eastvale Ave
- 563 Sylvandale Ave
- 544 Robindale Ave
- 2444 Eastvale Ave
Your Personal Tour Guide
Ask me questions while you tour the home.