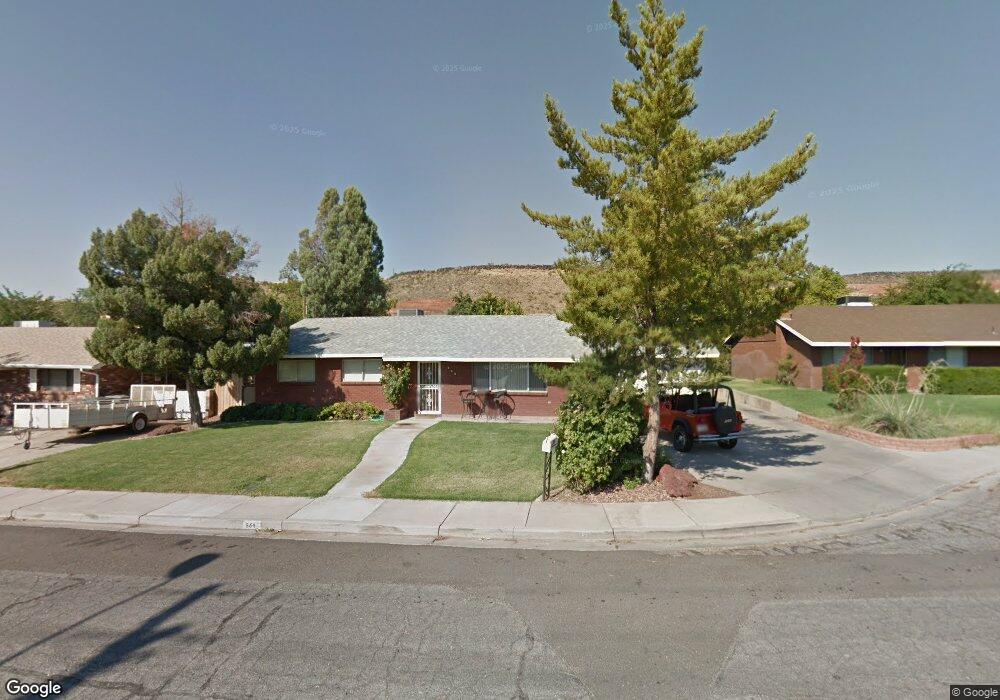
564 S 50 West Cir Saint George, UT 84770
Estimated Value: $400,000 - $471,000
3
Beds
2
Baths
1,770
Sq Ft
$241/Sq Ft
Est. Value
About This Home
This home is located at 564 S 50 West Cir, Saint George, UT 84770 and is currently estimated at $425,911, approximately $240 per square foot. 564 S 50 West Cir is a home located in Washington County with nearby schools including Heritage School, Dixie Middle School, and Dixie Intermediate School.
Ownership History
Date
Name
Owned For
Owner Type
Purchase Details
Closed on
May 15, 2013
Sold by
Guido Sue Ann
Bought by
Sal Properties Llc
Current Estimated Value
Home Financials for this Owner
Home Financials are based on the most recent Mortgage that was taken out on this home.
Original Mortgage
$76,034
Outstanding Balance
$53,636
Interest Rate
3.38%
Mortgage Type
New Conventional
Estimated Equity
$372,275
Purchase Details
Closed on
Apr 24, 2013
Sold by
Sal Properties Llc
Bought by
Guido Sue Ann
Home Financials for this Owner
Home Financials are based on the most recent Mortgage that was taken out on this home.
Original Mortgage
$76,034
Outstanding Balance
$53,636
Interest Rate
3.38%
Mortgage Type
New Conventional
Estimated Equity
$372,275
Purchase Details
Closed on
Jan 14, 2010
Sold by
Guido Sue Ann
Bought by
Sal Properties Llc
Create a Home Valuation Report for This Property
The Home Valuation Report is an in-depth analysis detailing your home's value as well as a comparison with similar homes in the area
Home Values in the Area
Average Home Value in this Area
Purchase History
| Date | Buyer | Sale Price | Title Company |
|---|---|---|---|
| Sal Properties Llc | -- | Magellan Title | |
| Sal Properties Llc | -- | Magellan Title | |
| Guido Sue Ann | -- | Magellan Title | |
| Sal Properties Llc | -- | None Available |
Source: Public Records
Mortgage History
| Date | Status | Borrower | Loan Amount |
|---|---|---|---|
| Open | Sal Properties Llc | $76,034 |
Source: Public Records
Tax History Compared to Growth
Tax History
| Year | Tax Paid | Tax Assessment Tax Assessment Total Assessment is a certain percentage of the fair market value that is determined by local assessors to be the total taxable value of land and additions on the property. | Land | Improvement |
|---|---|---|---|---|
| 2025 | $1,378 | $221,100 | $82,500 | $138,600 |
| 2023 | $1,483 | $221,595 | $52,250 | $169,345 |
| 2022 | $1,465 | $205,810 | $52,250 | $153,560 |
| 2021 | $1,363 | $285,600 | $65,000 | $220,600 |
| 2020 | $1,155 | $228,000 | $60,000 | $168,000 |
| 2019 | $1,144 | $220,500 | $55,000 | $165,500 |
| 2018 | $1,130 | $109,175 | $0 | $0 |
| 2017 | $997 | $96,360 | $0 | $0 |
| 2016 | $1,039 | $92,840 | $0 | $0 |
| 2015 | $959 | $82,280 | $0 | $0 |
| 2014 | $929 | $80,135 | $0 | $0 |
Source: Public Records
Map
Nearby Homes
- 544 S 100 W Unit 3
- 55 E 700 S Unit 8
- 55 W 400 S Unit 15
- 454 S 100 E Unit 10
- 433 S 100 E
- 524 S 200 E Unit 3
- 345 S 200 W Unit 3
- 155 W 300 S Unit 9
- 295 S Main St
- 377 S 300 W
- 379 S 300 W
- 800 W Bluff St S
- 135 S 100 St W
- 132 S 200 W
- 358 W 200 S
- 376 E 300 S Unit 2
- 96 S 200 E
- 443 E 700 S
- 777 S 400 E Unit 45
- 840 S 400 E Unit 45