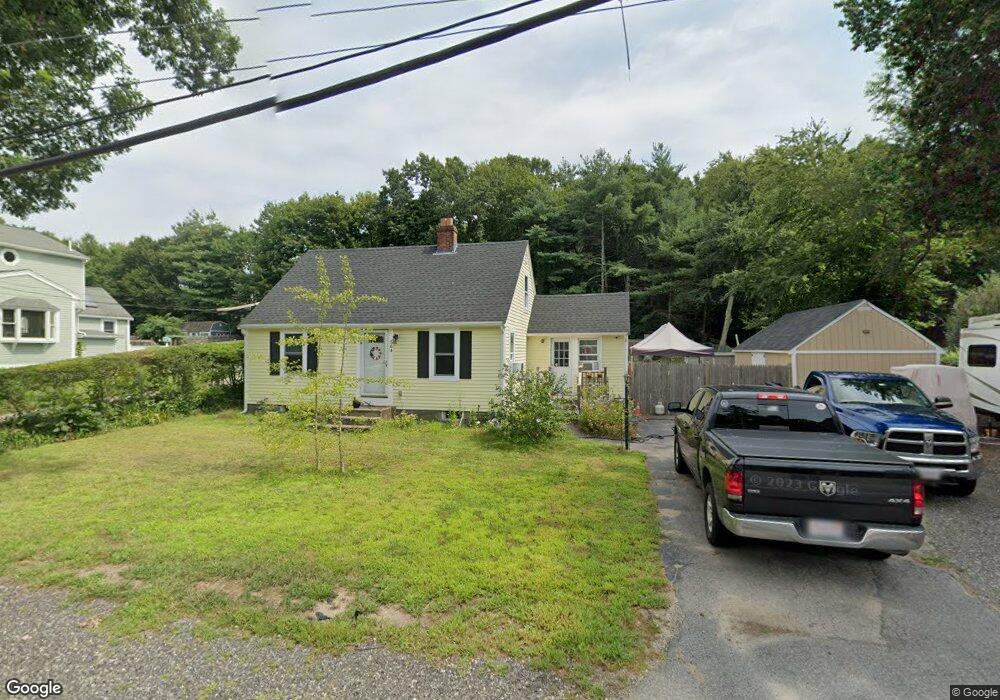
564 State St Hanson, MA 02341
Estimated Value: $457,322 - $642,000
2
Beds
1
Bath
1,140
Sq Ft
$475/Sq Ft
Est. Value
About This Home
This home is located at 564 State St, Hanson, MA 02341 and is currently estimated at $541,081, approximately $474 per square foot. 564 State St is a home located in Plymouth County with nearby schools including Cadence Academy Preschool - Hanover and Cardinal Cushing Centers.
Ownership History
Date
Name
Owned For
Owner Type
Purchase Details
Closed on
Feb 24, 2015
Sold by
Blake Maureen A
Bought by
George David M and George Maureen A
Current Estimated Value
Home Financials for this Owner
Home Financials are based on the most recent Mortgage that was taken out on this home.
Original Mortgage
$236,000
Outstanding Balance
$181,152
Interest Rate
3.74%
Mortgage Type
New Conventional
Estimated Equity
$359,929
Purchase Details
Closed on
Jun 17, 2008
Sold by
Blake Steven
Bought by
Blake Maureen A
Purchase Details
Closed on
Jul 6, 2004
Sold by
Maloney Linda K
Bought by
Blake Steven and Blake Maureen A
Home Financials for this Owner
Home Financials are based on the most recent Mortgage that was taken out on this home.
Original Mortgage
$270,751
Interest Rate
6.3%
Mortgage Type
Purchase Money Mortgage
Purchase Details
Closed on
Jul 3, 1990
Sold by
Maloney Eugene W
Bought by
Maloney Linda K
Create a Home Valuation Report for This Property
The Home Valuation Report is an in-depth analysis detailing your home's value as well as a comparison with similar homes in the area
Home Values in the Area
Average Home Value in this Area
Purchase History
| Date | Buyer | Sale Price | Title Company |
|---|---|---|---|
| George David M | -- | -- | |
| Blake Maureen A | -- | -- | |
| Blake Maureen A | -- | -- | |
| Blake Steven | $275,000 | -- | |
| Maloney Linda K | $12,000 | -- |
Source: Public Records
Mortgage History
| Date | Status | Borrower | Loan Amount |
|---|---|---|---|
| Open | George David M | $236,000 | |
| Previous Owner | Maloney Linda K | $268,000 | |
| Previous Owner | Maloney Linda K | $270,751 | |
| Previous Owner | Maloney Linda K | $10,000 |
Source: Public Records
Tax History
| Year | Tax Paid | Tax Assessment Tax Assessment Total Assessment is a certain percentage of the fair market value that is determined by local assessors to be the total taxable value of land and additions on the property. | Land | Improvement |
|---|---|---|---|---|
| 2025 | $5,380 | $402,100 | $187,200 | $214,900 |
| 2024 | $5,226 | $390,600 | $181,800 | $208,800 |
| 2023 | $5,092 | $359,100 | $181,800 | $177,300 |
| 2022 | $4,925 | $326,400 | $165,200 | $161,200 |
| 2021 | $4,359 | $288,700 | $158,900 | $129,800 |
| 2020 | $4,260 | $279,000 | $153,500 | $125,500 |
| 2019 | $4,109 | $264,600 | $150,500 | $114,100 |
| 2018 | $3,635 | $229,600 | $144,700 | $84,900 |
| 2017 | $3,520 | $220,300 | $137,900 | $82,400 |
| 2016 | $3,613 | $218,300 | $137,900 | $80,400 |
| 2015 | $3,450 | $216,700 | $137,900 | $78,800 |
Source: Public Records
Map
Nearby Homes
- 339 State St
- 430 Brook Bend Rd
- 114 Graham Hill Dr
- 51 Farmside Dr
- 108 Waterford Dr
- 7 Farmside Dr
- 285 W Elm St
- 35 Sproul Rd
- 139 Fairwood Dr
- 51 Cervelli Farm Dr
- 37 Dr
- 23 Cervelli Farm Dr
- 38 Cervelli Farm Dr
- 9 Cervelli Farm Dr
- 250 Center St
- 60 Summer Path Way
- 95 Tecumseh Dr
- 36 Grove St
- 26 Stonebridge Dr
- 127 Crescent Place
Your Personal Tour Guide
Ask me questions while you tour the home.