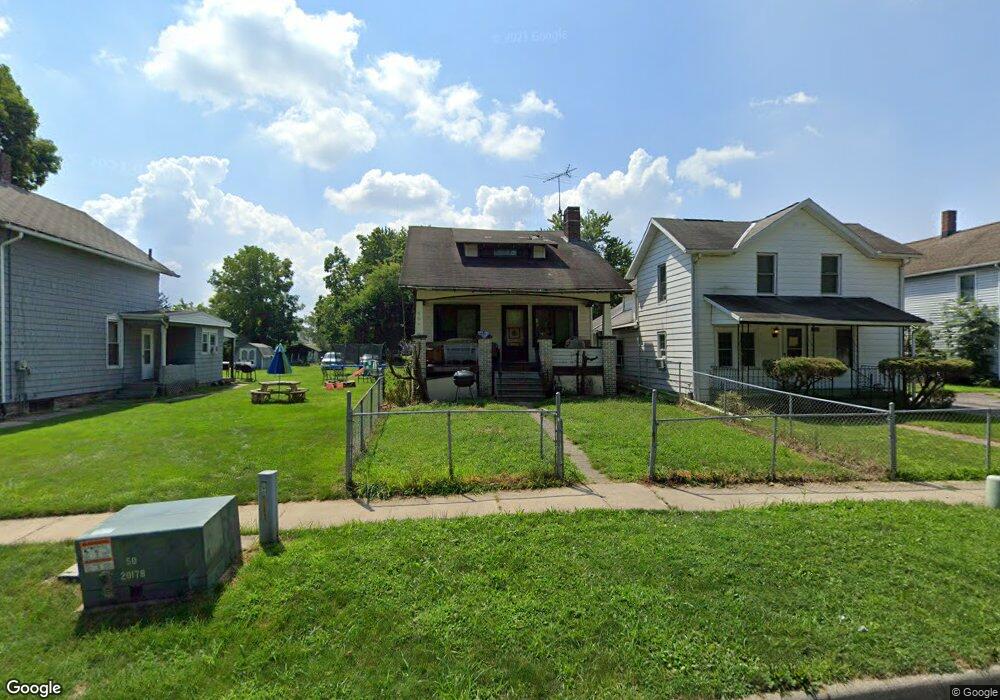
564 Turner St Elyria, OH 44035
Estimated Value: $99,124 - $128,000
3
Beds
2
Baths
1,049
Sq Ft
$110/Sq Ft
Est. Value
About This Home
This home is located at 564 Turner St, Elyria, OH 44035 and is currently estimated at $115,781, approximately $110 per square foot. 564 Turner St is a home located in Lorain County with nearby schools including Eastern Heights Middle School, Elyria High School, and St Mary Elementary School.
Ownership History
Date
Name
Owned For
Owner Type
Purchase Details
Closed on
Jan 10, 2025
Sold by
Mccall Arthur A M
Bought by
Mccall Investments
Current Estimated Value
Purchase Details
Closed on
Sep 28, 2019
Sold by
Capers Bobby L
Bought by
Mccall Arthur
Purchase Details
Closed on
Apr 5, 2002
Sold by
Capers Lola B and Capers Lola
Bought by
Capers Bobby L
Home Financials for this Owner
Home Financials are based on the most recent Mortgage that was taken out on this home.
Original Mortgage
$72,000
Interest Rate
6.82%
Purchase Details
Closed on
Jul 22, 1999
Sold by
Capers Lola B and Capers Lola
Bought by
Capers Lola B and Capers Barbara
Home Financials for this Owner
Home Financials are based on the most recent Mortgage that was taken out on this home.
Original Mortgage
$64,000
Interest Rate
7.54%
Mortgage Type
Balloon
Create a Home Valuation Report for This Property
The Home Valuation Report is an in-depth analysis detailing your home's value as well as a comparison with similar homes in the area
Home Values in the Area
Average Home Value in this Area
Purchase History
| Date | Buyer | Sale Price | Title Company |
|---|---|---|---|
| Mccall Investments | -- | None Listed On Document | |
| Mccall Arthur | $10,500 | None Available | |
| Capers Bobby L | -- | Chelsea Title Agency | |
| Capers Lola B | -- | Tower City Title Agency Inc |
Source: Public Records
Mortgage History
| Date | Status | Borrower | Loan Amount |
|---|---|---|---|
| Previous Owner | Capers Bobby L | $72,000 | |
| Previous Owner | Capers Lola B | $64,000 |
Source: Public Records
Tax History
| Year | Tax Paid | Tax Assessment Tax Assessment Total Assessment is a certain percentage of the fair market value that is determined by local assessors to be the total taxable value of land and additions on the property. | Land | Improvement |
|---|---|---|---|---|
| 2024 | $1,303 | $26,880 | $4,277 | $22,603 |
| 2023 | $704 | $12,600 | $1,880 | $10,721 |
| 2022 | $701 | $12,600 | $1,880 | $10,721 |
| 2021 | $735 | $12,600 | $1,880 | $10,720 |
| 2020 | $691 | $10,770 | $1,610 | $9,160 |
| 2019 | $687 | $10,770 | $1,610 | $9,160 |
| 2018 | $742 | $10,770 | $1,610 | $9,160 |
| 2017 | $796 | $12,010 | $1,580 | $10,430 |
| 2016 | $753 | $12,010 | $1,580 | $10,430 |
| 2015 | $706 | $12,010 | $1,580 | $10,430 |
| 2014 | $697 | $12,010 | $1,580 | $10,430 |
| 2013 | $690 | $12,010 | $1,580 | $10,430 |
Source: Public Records
Map
Nearby Homes
- 560 Turner St
- 574 Turner St
- 554 Turner St
- 125 W River Rd N
- 552 Turner St
- 117 W River Rd N
- 559 3rd St
- 553 3rd St
- 547 3rd St
- 544 Turner St
- 543 3rd St
- 540 Turner St
- 536 Turner St
- 122 W River Rd N
- 122 W River Rd N Unit 1
- 118 W River Rd N
- 120 W River Rd N
- 116 W River Rd N
- 114 W River Rd N
- 398 W River St S
Your Personal Tour Guide
Ask me questions while you tour the home.