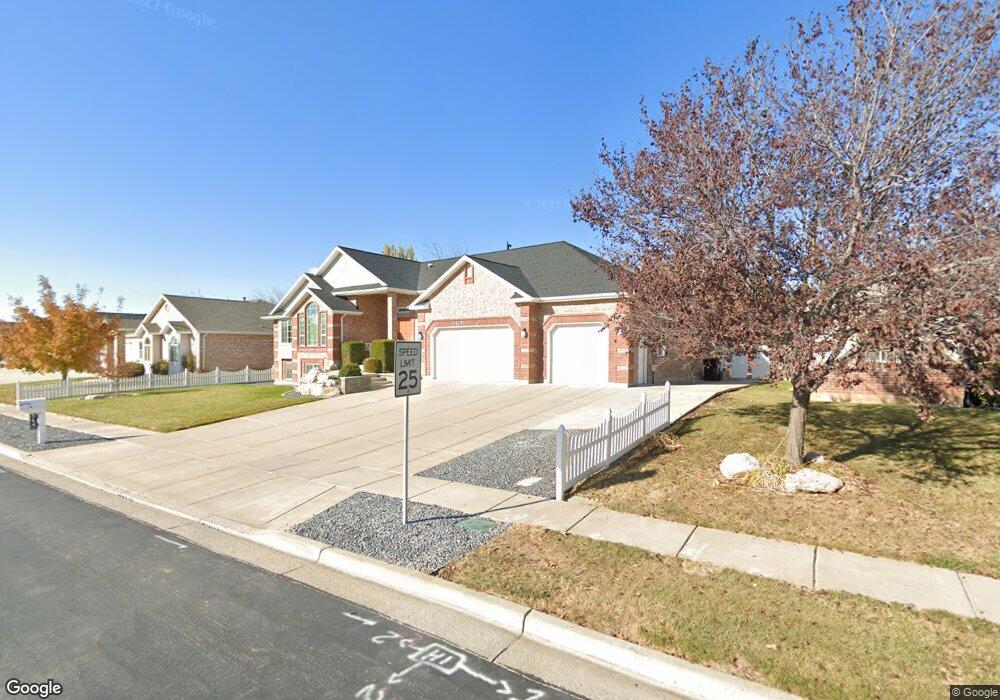
564 W 2525 S Syracuse, UT 84075
Estimated Value: $644,000 - $758,240
4
Beds
3
Baths
2,145
Sq Ft
$334/Sq Ft
Est. Value
About This Home
This home is located at 564 W 2525 S, Syracuse, UT 84075 and is currently estimated at $716,310, approximately $333 per square foot. 564 W 2525 S is a home located in Davis County with nearby schools including Bluff Ridge Elementary, Legacy Junior High School, and Clearfield High School.
Ownership History
Date
Name
Owned For
Owner Type
Purchase Details
Closed on
Nov 30, 2023
Sold by
Storey Patricia A and Storey David A
Bought by
Storey Family Trust and Storey
Current Estimated Value
Purchase Details
Closed on
Nov 10, 2010
Sold by
Storey David A and Storey Patricia A
Bought by
Storey Patricia A and Storey David A
Home Financials for this Owner
Home Financials are based on the most recent Mortgage that was taken out on this home.
Original Mortgage
$264,000
Interest Rate
4.27%
Mortgage Type
New Conventional
Purchase Details
Closed on
Mar 31, 1998
Sold by
Scoffield Steven and Scoffield Diane
Bought by
Storey David A and Storey Patricia A
Home Financials for this Owner
Home Financials are based on the most recent Mortgage that was taken out on this home.
Original Mortgage
$196,000
Interest Rate
7%
Create a Home Valuation Report for This Property
The Home Valuation Report is an in-depth analysis detailing your home's value as well as a comparison with similar homes in the area
Home Values in the Area
Average Home Value in this Area
Purchase History
| Date | Buyer | Sale Price | Title Company |
|---|---|---|---|
| Storey Family Trust | -- | None Listed On Document | |
| Storey Patricia A | -- | Hickman Land Title Co | |
| Storey David A | -- | Bonneville Title Company |
Source: Public Records
Mortgage History
| Date | Status | Borrower | Loan Amount |
|---|---|---|---|
| Previous Owner | Storey Patricia A | $264,000 | |
| Previous Owner | Storey David A | $196,000 |
Source: Public Records
Tax History
| Year | Tax Paid | Tax Assessment Tax Assessment Total Assessment is a certain percentage of the fair market value that is determined by local assessors to be the total taxable value of land and additions on the property. | Land | Improvement |
|---|---|---|---|---|
| 2025 | $3,991 | $385,000 | $132,713 | $252,287 |
| 2024 | $3,771 | $366,300 | $117,621 | $248,679 |
| 2023 | $3,548 | $628,000 | $163,426 | $464,574 |
| 2022 | $3,730 | $361,900 | $92,967 | $268,933 |
| 2021 | $3,322 | $499,000 | $138,299 | $360,701 |
| 2020 | $3,026 | $440,000 | $116,490 | $323,510 |
| 2019 | $2,905 | $417,000 | $118,754 | $298,246 |
| 2018 | $2,737 | $390,000 | $112,039 | $277,961 |
| 2016 | $2,516 | $187,990 | $42,824 | $145,166 |
| 2015 | $2,675 | $190,355 | $42,824 | $147,531 |
| 2014 | $2,513 | $182,292 | $42,824 | $139,468 |
| 2013 | -- | $167,201 | $41,329 | $125,872 |
Source: Public Records
Map
Nearby Homes
Your Personal Tour Guide
Ask me questions while you tour the home.