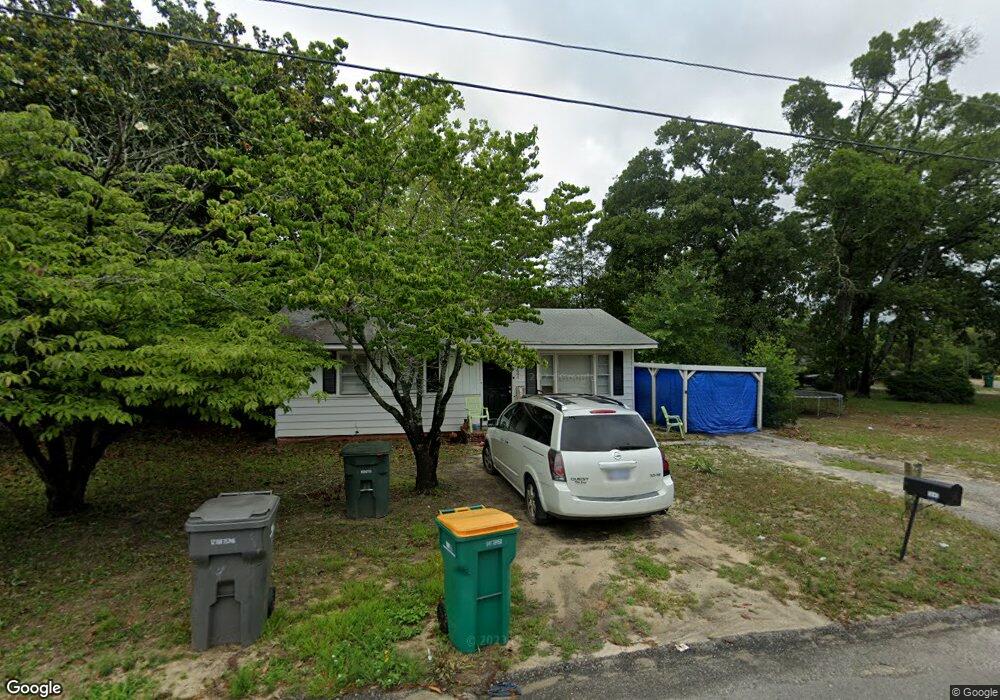
5640 Duncan St Hope Mills, NC 28348
South View NeighborhoodEstimated Value: $103,000 - $120,000
3
Beds
1
Bath
875
Sq Ft
$129/Sq Ft
Est. Value
About This Home
This home is located at 5640 Duncan St, Hope Mills, NC 28348 and is currently estimated at $112,801, approximately $128 per square foot. 5640 Duncan St is a home located in Cumberland County with nearby schools including Rockfish Elementary, Hope Mills Middle, and South View High.
Ownership History
Date
Name
Owned For
Owner Type
Purchase Details
Closed on
Nov 25, 2020
Sold by
Sfr3 Garg I Llc
Bought by
Sfr3 010 Llc
Current Estimated Value
Purchase Details
Closed on
Sep 16, 2019
Sold by
Bizub Bozeman Kimberlee
Bought by
Sfr3 Llc
Purchase Details
Closed on
Jan 13, 2003
Sold by
Brown Cordie M
Bought by
Bizub John W
Home Financials for this Owner
Home Financials are based on the most recent Mortgage that was taken out on this home.
Original Mortgage
$37,600
Interest Rate
6.1%
Mortgage Type
New Conventional
Create a Home Valuation Report for This Property
The Home Valuation Report is an in-depth analysis detailing your home's value as well as a comparison with similar homes in the area
Home Values in the Area
Average Home Value in this Area
Purchase History
| Date | Buyer | Sale Price | Title Company |
|---|---|---|---|
| Sfr3 010 Llc | $293,500 | None Available | |
| Sfr3 Llc | $248,000 | Attorney | |
| Bizub John W | $47,000 | -- |
Source: Public Records
Mortgage History
| Date | Status | Borrower | Loan Amount |
|---|---|---|---|
| Previous Owner | Bizub John W | $37,600 |
Source: Public Records
Tax History Compared to Growth
Tax History
| Year | Tax Paid | Tax Assessment Tax Assessment Total Assessment is a certain percentage of the fair market value that is determined by local assessors to be the total taxable value of land and additions on the property. | Land | Improvement |
|---|---|---|---|---|
| 2024 | $1,918 | $53,943 | $10,000 | $43,943 |
| 2023 | $1,237 | $53,943 | $10,000 | $43,943 |
| 2022 | $1,185 | $53,943 | $10,000 | $43,943 |
| 2021 | $1,148 | $53,943 | $10,000 | $43,943 |
| 2019 | $1,137 | $60,600 | $10,000 | $50,600 |
| 2018 | $1,113 | $60,600 | $10,000 | $50,600 |
| 2017 | $1,113 | $60,600 | $10,000 | $50,600 |
| 2016 | $1,141 | $66,300 | $9,750 | $56,550 |
| 2015 | $1,141 | $66,300 | $9,750 | $56,550 |
| 2014 | $1,141 | $66,300 | $9,750 | $56,550 |
Source: Public Records
Map
Nearby Homes