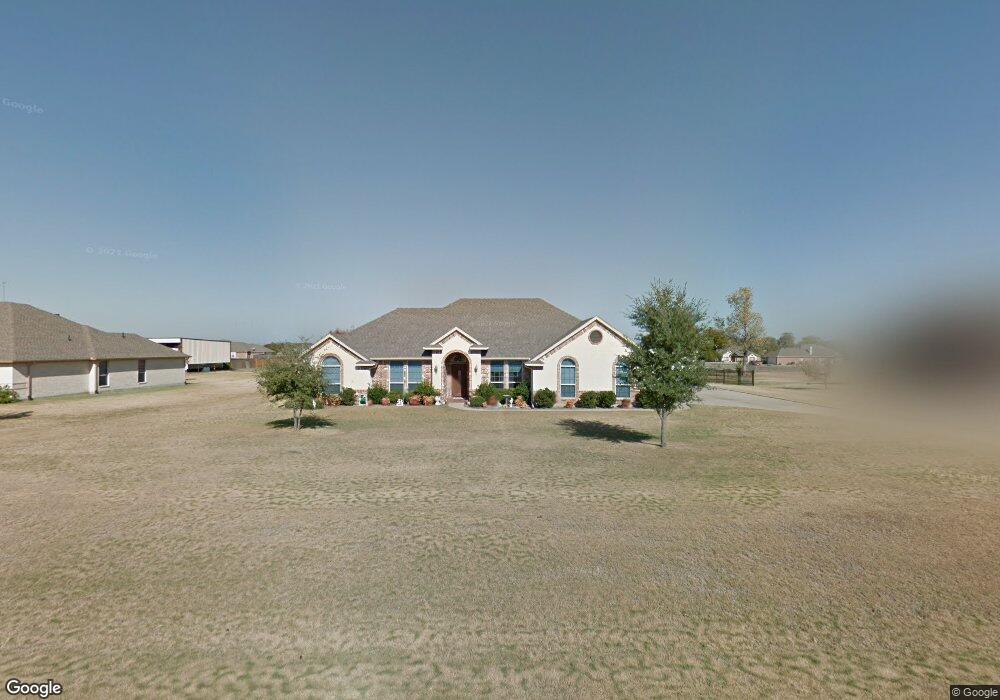
5641 Niagara Ct Midlothian, TX 76065
Estimated Value: $496,121 - $608,000
3
Beds
2
Baths
2,303
Sq Ft
$240/Sq Ft
Est. Value
About This Home
This home is located at 5641 Niagara Ct, Midlothian, TX 76065 and is currently estimated at $552,061, approximately $239 per square foot. 5641 Niagara Ct is a home located in Ellis County with nearby schools including Dolores McClatchey El, Walnut Grove Middle School, and Midlothian Heritage High School.
Ownership History
Date
Name
Owned For
Owner Type
Purchase Details
Closed on
Sep 3, 2021
Sold by
Mischa Johnson Neila
Bought by
Johnson Neila Misch A and Johnson Glenn
Current Estimated Value
Purchase Details
Closed on
Mar 27, 2007
Sold by
Munn Jimmy N and Munn Joy
Bought by
Munn Jimmy N and Munn Joy
Create a Home Valuation Report for This Property
The Home Valuation Report is an in-depth analysis detailing your home's value as well as a comparison with similar homes in the area
Home Values in the Area
Average Home Value in this Area
Purchase History
| Date | Buyer | Sale Price | Title Company |
|---|---|---|---|
| Johnson Neila Misch A | -- | Lindauer Joyce W | |
| Munn Jimmy N | -- | None Available |
Source: Public Records
Tax History Compared to Growth
Tax History
| Year | Tax Paid | Tax Assessment Tax Assessment Total Assessment is a certain percentage of the fair market value that is determined by local assessors to be the total taxable value of land and additions on the property. | Land | Improvement |
|---|---|---|---|---|
| 2025 | $4,634 | $428,485 | $145,000 | $283,485 |
| 2024 | $4,634 | $423,325 | $130,000 | $293,325 |
| 2023 | $4,634 | $440,000 | $130,000 | $310,000 |
| 2022 | $6,947 | $411,059 | $120,000 | $291,059 |
| 2021 | $6,625 | $369,930 | $70,000 | $299,930 |
| 2020 | $6,497 | $378,610 | $70,000 | $308,610 |
| 2019 | $6,151 | $305,960 | $0 | $0 |
| 2018 | $3,005 | $279,920 | $45,000 | $234,920 |
| 2017 | $5,636 | $274,450 | $45,000 | $229,450 |
| 2016 | $5,143 | $250,430 | $40,000 | $210,430 |
| 2015 | $3,089 | $233,210 | $40,000 | $193,210 |
| 2014 | $3,089 | $221,580 | $0 | $0 |
Source: Public Records
Map
Nearby Homes
- 5431 Jennifer Ln
- 2921 N Mockingbird Ln
- 5221 Bravo Rd
- 5211 Bravo Rd
- 5051 Bravo Rd
- 5031 Bravo Rd
- 5041 Bravo Rd
- 5061 Bravo Rd
- 5060 Bravo Rd
- 5220 Bravo Rd
- 3340 Pleasantville Rd
- 2510 Eagles Nest Ct
- 2330 Bois d Arc Ln
- 6010 Lindenwood Dr
- 4620 Maggie Ln
- 5610 Judy Dr
- 6030 Lindenwood Dr
- 3131 Bryson Ln
- TBD Bryson Ln
- 6031 Judy Dr
- 5631 Niagara Ct
- 5651 Niagara Ct
- 5621 Niagara Ct
- 5640 Niagara Ct
- 5630 Niagara Ct
- 5811 Jade Ct
- 5650 Niagara Ct
- 5640 Deerfield Ln
- 5630 Deerfield Ln
- 5620 Niagara Ct
- 5650 Deerfield Ln
- 5810 Jade Ct
- 5611 Niagara Ct
- 5620 Deerfield Ln
- 5810 Deerfield Ln
- 5821 Jade Ct
- 5610 Niagara Ct
- 5820 Jade Ct
- 5610 Deerfield Ln
- 5820 Deerfield Ln