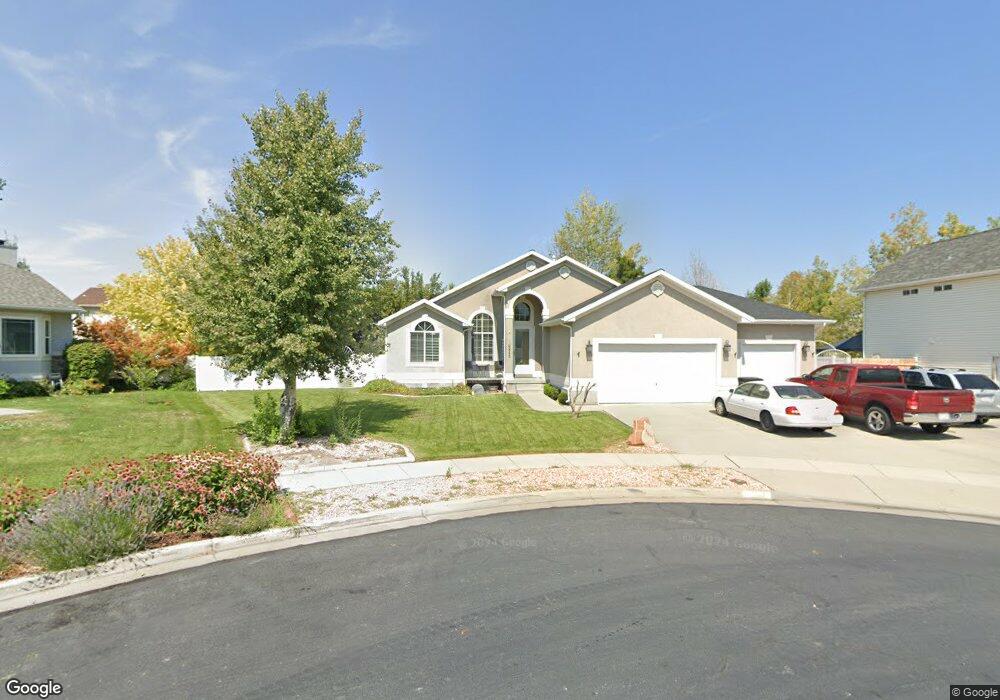
5645 Inverness Ct Unit 318 Tooele, UT 84074
Estimated Value: $495,000 - $515,000
3
Beds
2
Baths
2,373
Sq Ft
$213/Sq Ft
Est. Value
About This Home
This home is located at 5645 Inverness Ct Unit 318, Tooele, UT 84074 and is currently estimated at $505,743, approximately $213 per square foot. 5645 Inverness Ct Unit 318 is a home located in Tooele County with nearby schools including Stansbury Park Elementary School, Clarke N. Johnsen Junior High School, and Stansbury High School.
Ownership History
Date
Name
Owned For
Owner Type
Purchase Details
Closed on
Mar 4, 2024
Sold by
Garcia Steve
Bought by
Kinney Kole M and Kinney Lisa
Current Estimated Value
Purchase Details
Closed on
Dec 15, 2016
Sold by
Thomas Todd M and Thomas Shauna D
Bought by
Garcia Steve
Home Financials for this Owner
Home Financials are based on the most recent Mortgage that was taken out on this home.
Original Mortgage
$210,000
Interest Rate
3.54%
Mortgage Type
New Conventional
Purchase Details
Closed on
Aug 26, 2010
Sold by
Thomas Todd M and Thomas Shauna D
Bought by
Thomas Todd M and Thomas Shauna D
Home Financials for this Owner
Home Financials are based on the most recent Mortgage that was taken out on this home.
Original Mortgage
$260,614
Interest Rate
4.52%
Mortgage Type
Purchase Money Mortgage
Create a Home Valuation Report for This Property
The Home Valuation Report is an in-depth analysis detailing your home's value as well as a comparison with similar homes in the area
Home Values in the Area
Average Home Value in this Area
Purchase History
| Date | Buyer | Sale Price | Title Company |
|---|---|---|---|
| Kinney Kole M | -- | None Listed On Document | |
| Garcia Steve | -- | Inwest Title Tooele Office | |
| Thomas Todd M | -- | Sutherland Title Co |
Source: Public Records
Mortgage History
| Date | Status | Borrower | Loan Amount |
|---|---|---|---|
| Previous Owner | Garcia Steve | $210,000 | |
| Previous Owner | Thomas Todd M | $260,614 |
Source: Public Records
Tax History Compared to Growth
Tax History
| Year | Tax Paid | Tax Assessment Tax Assessment Total Assessment is a certain percentage of the fair market value that is determined by local assessors to be the total taxable value of land and additions on the property. | Land | Improvement |
|---|---|---|---|---|
| 2025 | $4,076 | $283,335 | $82,500 | $200,835 |
| 2024 | $4,132 | $265,494 | $82,500 | $182,994 |
| 2023 | $4,132 | $285,055 | $82,500 | $202,555 |
| 2022 | $3,420 | $274,474 | $74,250 | $200,224 |
| 2021 | $3,011 | $199,573 | $59,813 | $139,760 |
| 2020 | $2,865 | $332,078 | $77,500 | $254,578 |
| 2019 | $2,643 | $301,311 | $77,500 | $223,811 |
| 2018 | $2,535 | $276,828 | $40,000 | $236,828 |
| 2017 | $2,210 | $255,298 | $40,000 | $215,298 |
| 2016 | $1,898 | $124,969 | $22,000 | $102,969 |
| 2015 | $1,898 | $119,140 | $0 | $0 |
| 2014 | -- | $119,140 | $0 | $0 |
Source: Public Records
Map
Nearby Homes
- 5546 Ardennes Way
- 5538 Geneva Way
- 5502 Ardennes Way
- 198 Clermont Ln
- 62 Fairway Dr
- 57 Fairway Dr
- 5634 Miller Cir
- 5581 Brienne Way
- 5584 N Gentle Breeze Ct
- 5451 Heather Way
- 789 Country Club Dr
- 45 W Streams Edge Way
- 5419 Heather Way
- 5718 Lanyard Ln
- 369 Culross Cir
- 5675 Lanyard Ln
- 133 W Marigold Cir Unit 311
- 5489 Hampton Way
- 137 Stern Ct
- 5531 Ponderosa Ln
- 5645 Inverness Ct
- 5655 W Iverness Ct
- 5655 Inverness Ct
- 138 Pebble Beach Dr
- 5637 Inverness Ct
- 126 Pebble Beach Dr
- 142 Spyglass Dr
- 5636 Inverness Ct
- 5614 Inverness Ct
- 145 Spyglass Dr
- 5624 Inverness Ct
- 133 Spyglass Dr
- 116 Pebble Beach Dr
- 159 Spyglass Dr
- 139 Pebble Beach Dr
- 114 Spyglass Dr
- 107 Pebble Beach Dr
- 171 Spyglass Dr
- 185 Spyglass Dr
- 5627 Oakmont Ct