5646 Needham Dr Oxford, NC 27565
Estimated Value: $302,000 - $353,848
3
Beds
2
Baths
1,300
Sq Ft
$246/Sq Ft
Est. Value
About This Home
This home is located at 5646 Needham Dr, Oxford, NC 27565 and is currently estimated at $319,962, approximately $246 per square foot. 5646 Needham Dr is a home located in Granville County with nearby schools including West Oxford Elementary School, Northern Granville Middle School, and J.F. Webb High School.
Ownership History
Date
Name
Owned For
Owner Type
Purchase Details
Closed on
Jun 27, 2022
Sold by
Jean Bolt
Bought by
Holt Logan K
Current Estimated Value
Home Financials for this Owner
Home Financials are based on the most recent Mortgage that was taken out on this home.
Original Mortgage
$210,000
Outstanding Balance
$196,739
Interest Rate
3.5%
Mortgage Type
New Conventional
Estimated Equity
$123,223
Purchase Details
Closed on
Feb 14, 2019
Sold by
Russell Sherry Marks and Russell George T
Bought by
Holt Logan K and Holt Jean S
Home Financials for this Owner
Home Financials are based on the most recent Mortgage that was taken out on this home.
Original Mortgage
$148,500
Interest Rate
4.37%
Mortgage Type
Adjustable Rate Mortgage/ARM
Purchase Details
Closed on
Oct 10, 2007
Sold by
Marks Merdis C
Bought by
Russell Sherry Marks and Marks Anthony Scott
Create a Home Valuation Report for This Property
The Home Valuation Report is an in-depth analysis detailing your home's value as well as a comparison with similar homes in the area
Home Values in the Area
Average Home Value in this Area
Purchase History
| Date | Buyer | Sale Price | Title Company |
|---|---|---|---|
| Holt Logan K | -- | Garren Nathan M | |
| Holt Logan K | -- | None Listed On Document | |
| Holt Logan K | $165,000 | None Available | |
| Russell Sherry Marks | -- | -- |
Source: Public Records
Mortgage History
| Date | Status | Borrower | Loan Amount |
|---|---|---|---|
| Open | Holt Logan K | $210,000 | |
| Closed | Holt Logan K | $210,000 | |
| Previous Owner | Holt Logan K | $148,500 |
Source: Public Records
Tax History Compared to Growth
Tax History
| Year | Tax Paid | Tax Assessment Tax Assessment Total Assessment is a certain percentage of the fair market value that is determined by local assessors to be the total taxable value of land and additions on the property. | Land | Improvement |
|---|---|---|---|---|
| 2025 | $1,991 | $272,337 | $78,123 | $194,214 |
| 2024 | $1,991 | $272,337 | $78,123 | $194,214 |
| 2023 | $1,302 | $131,068 | $31,532 | $99,536 |
| 2022 | $1,281 | $131,068 | $31,532 | $99,536 |
| 2021 | $1,111 | $131,068 | $31,532 | $99,536 |
| 2020 | $1,111 | $131,068 | $31,532 | $99,536 |
| 2019 | $640 | $131,068 | $31,532 | $99,536 |
| 2018 | $640 | $131,068 | $31,532 | $99,536 |
| 2016 | $618 | $119,228 | $30,182 | $89,046 |
| 2015 | $583 | $119,228 | $30,182 | $89,046 |
| 2014 | $583 | $119,228 | $30,182 | $89,046 |
| 2013 | -- | $119,228 | $30,182 | $89,046 |
Source: Public Records
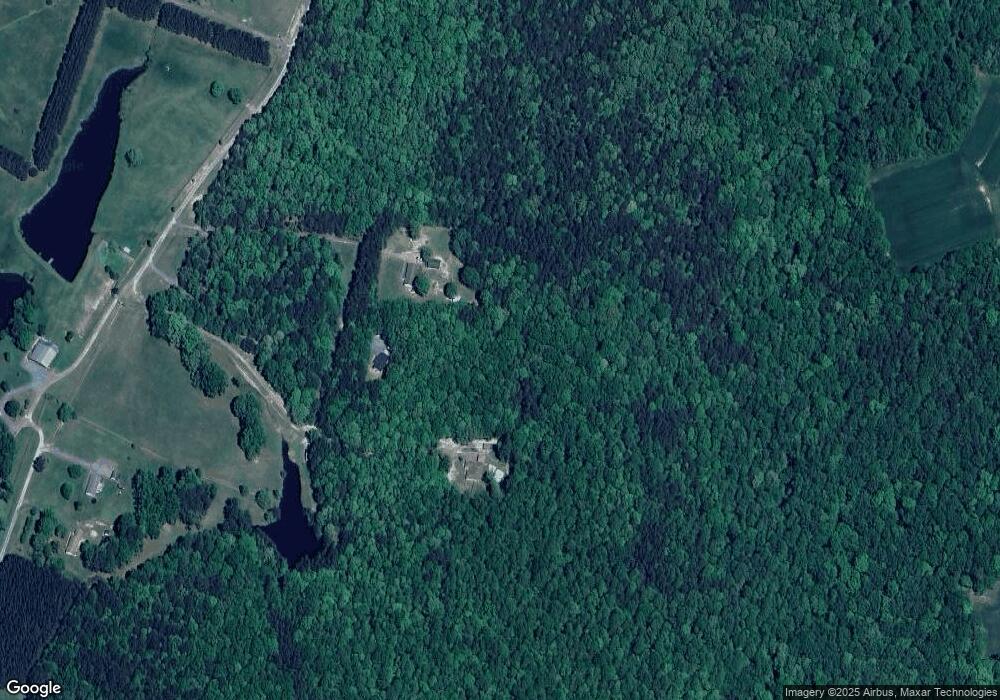
Map
Nearby Homes
- 1545 Dogwood Dr
- 5606 Oakley Hill
- 5586 Shelton Creek Rd
- 24 Acres Bob Daniel Rd
- 6079 Zachary Ln
- 5148 Lucy Averette Rd
- 6035 Mary Lee Dr
- 2536 Enon Rd
- 595 George Sherman Rd
- 0 Old Roxboro Rd Unit 10027603
- 2605 Joe Pruitt Rd
- 1665 Satterwhite Rd
- 2077 Satterwhite Rd
- 2085 Satterwhite Rd
- 2097 Satterwhite Rd
- 2665 Bodie Currin Rd
- 6708 Old Roxboro Rd
- 6049 Mulberry Ln
- 4551 Sugar Maple Rd
- 316 Acorn Ct
- 5648 Needham Dr
- 5648 Needham Dr
- 5644 Needham Dr
- 5632 Wingate Creek Rd
- 5628 Wingate Creek Rd
- 5628 Wingate Creek Rd
- 4 Wingate Creek Rd
- Lot#25 Wingate Creek Rd
- Lot#26 Wingate Creek Rd
- 02 Wingate Creek Rd
- 28 Wingate Creek Rd
- 5611 Wingate Creek Rd
- 32 Wingate Creek Rd
- 0 Wingate Creek Rd Unit 1683390
- 0 Wingate Creek Rd Unit 1965566
- 0 Wingate Creek Rd Unit 1906153
- Lot 4 Wingate Creek Rd
- Lot 2 Wingate Creek Rd
- 000 Wingate Creek Rd Unit 2
- 0 Wingate Creek Rd Unit 2 TR1965566