56466 High St Bridgeport, OH 43912
Estimated Value: $44,390 - $92,000
1
Bed
1
Bath
580
Sq Ft
$109/Sq Ft
Est. Value
About This Home
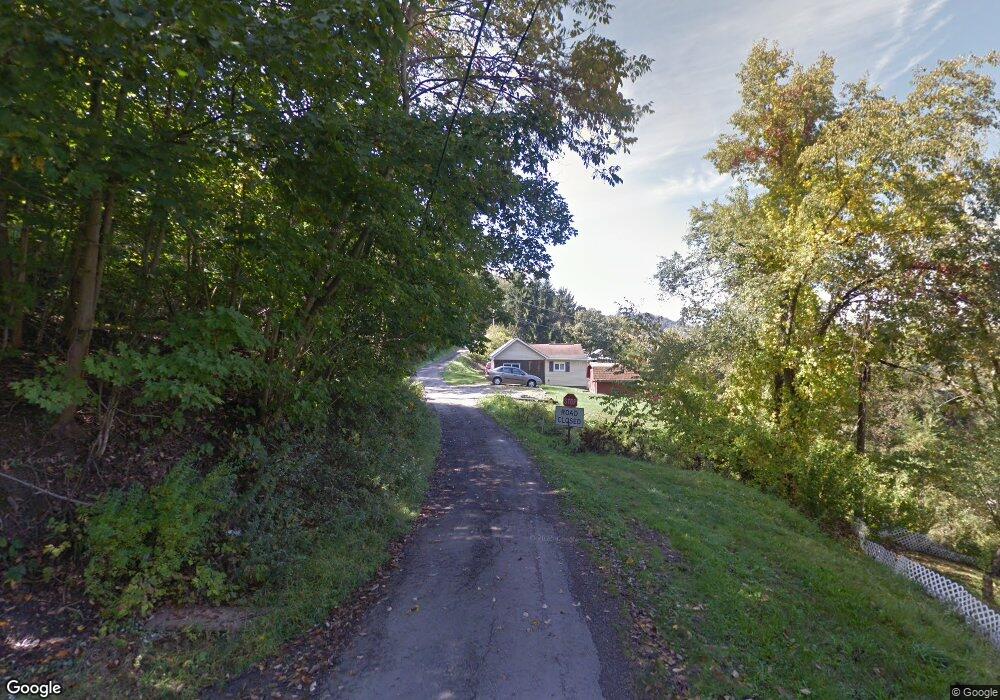
This home is located at 56466 High St, Bridgeport, OH 43912 and is currently estimated at $63,348, approximately $109 per square foot. 56466 High St is a home located in Belmont County with nearby schools including Bridgeport Elementary School, Bridgeport Middle School, and Bridgeport High School.
Ownership History
Date
Name
Owned For
Owner Type
Purchase Details
Closed on
Feb 1, 2018
Sold by
Groff Loretta and Crane Phoebe H
Bought by
Crane Phoebe H and Crane Phoebe
Current Estimated Value
Purchase Details
Closed on
Jan 31, 2018
Sold by
Crane Phoebe H and Crane Phoebe
Bought by
Calrk Jodie E
Purchase Details
Closed on
Jul 11, 2017
Sold by
Groff Loretta A
Bought by
Groff Loretta A and Crane Phoebe
Purchase Details
Closed on
Mar 3, 2008
Sold by
Springer Gordon L and Springer Tammy L
Bought by
Groff Loretta A
Purchase Details
Closed on
Nov 9, 2000
Sold by
Springer Gordon L and Springer Tammy
Bought by
Springer Gordon L and Springer Tammy
Purchase Details
Closed on
May 20, 1996
Sold by
Crane Jackqueline L
Bought by
Crane Jackqueline L
Purchase Details
Closed on
Sep 5, 1995
Sold by
Crane Garnet M
Bought by
Crane Garnet M
Purchase Details
Closed on
Jan 1, 1986
Sold by
Crane Herman W
Bought by
Crane Herman W
Create a Home Valuation Report for This Property
The Home Valuation Report is an in-depth analysis detailing your home's value as well as a comparison with similar homes in the area
Home Values in the Area
Average Home Value in this Area
Purchase History
| Date | Buyer | Sale Price | Title Company |
|---|---|---|---|
| Crane Phoebe H | -- | None Available | |
| Calrk Jodie E | -- | None Available | |
| Groff Loretta A | -- | Attorney | |
| Groff Loretta A | $32,000 | Attorney | |
| Springer Gordon L | $16,000 | -- | |
| Crane Jackqueline L | $7,000 | -- | |
| Crane Garnet M | -- | -- | |
| Crane Herman W | -- | -- |
Source: Public Records
Tax History Compared to Growth
Tax History
| Year | Tax Paid | Tax Assessment Tax Assessment Total Assessment is a certain percentage of the fair market value that is determined by local assessors to be the total taxable value of land and additions on the property. | Land | Improvement |
|---|---|---|---|---|
| 2024 | $287 | $6,970 | $1,010 | $5,960 |
| 2023 | $346 | $8,720 | $810 | $7,910 |
| 2022 | $346 | $8,718 | $805 | $7,913 |
| 2021 | $344 | $8,718 | $805 | $7,913 |
| 2020 | $307 | $7,260 | $670 | $6,590 |
| 2019 | $325 | $7,260 | $670 | $6,590 |
| 2018 | $10 | $7,260 | $670 | $6,590 |
| 2017 | $5 | $4,790 | $1,360 | $3,430 |
| 2016 | $10 | $4,790 | $1,360 | $3,430 |
| 2015 | $10 | $4,790 | $1,360 | $3,430 |
| 2014 | $13 | $5,230 | $1,240 | $3,990 |
| 2013 | -- | $5,230 | $1,240 | $3,990 |
Source: Public Records
Map
Nearby Homes
- 56624 Boyd Ave
- 56065 National Rd
- 56316 National Rd
- 902 National Rd
- 1123 Minellen Dr
- 4 Walnut Ave
- 26 Elm St
- 866 Main St
- 836 Main St
- 67478 Kirkwood Heights Rd
- 824 Howard St
- 822 W Bennett St
- 67531 Kirkwood Heights Rd
- 629 1/2 Howard St
- 55500 National Rd
- 55490 National Rd
- 55480 National Rd
- 67730 Kirkwood Heights Rd
- 308 Whitely St
- 69142 Woods Rd
- 67461 Plum St
- 56477 High St
- 67480 Plum St
- 56464 High St
- 56540 S Winning St
- 56520 S Winning St
- 56490 S Winning St
- 56490 S Winning St
- 56458 High St
- 56541 High St
- 56500 Boyd Ave
- 56459 High St
- 56486 Boyd Ave
- 56482 Boyd Ave
- 67479 Winning Ave
- 56480 Boyd Ave
- 56528 Boyd Ave
- 56460 S Winning St
- 56553 High St
- 56470 Boyd Ave