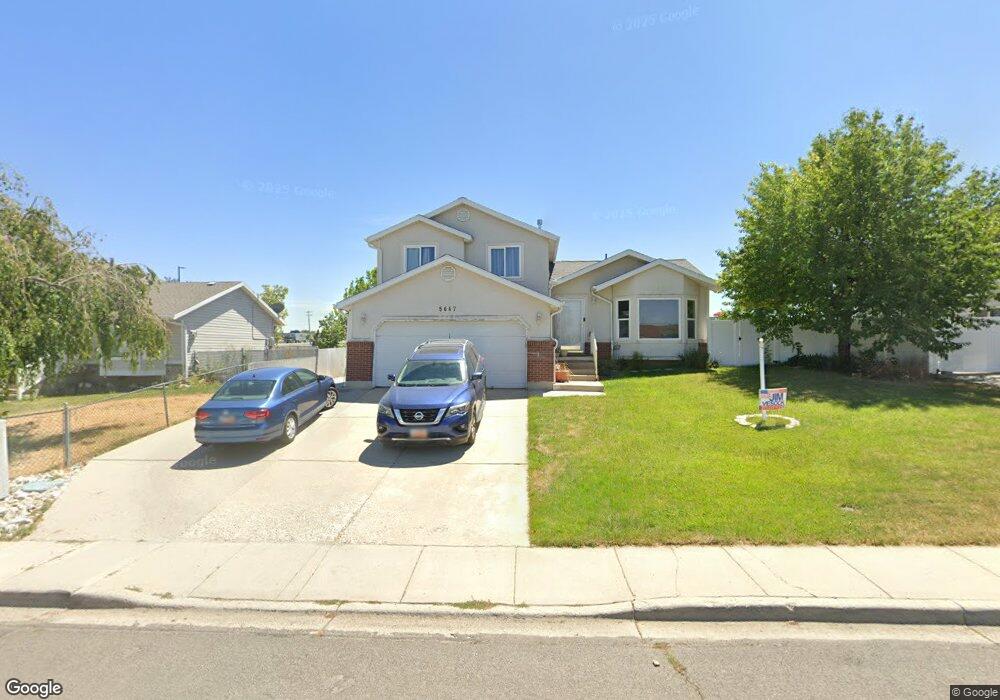
5647 Cape Vista Way Salt Lake City, UT 84128
Hunter NeighborhoodEstimated Value: $472,246 - $527,000
3
Beds
2
Baths
1,409
Sq Ft
$349/Sq Ft
Est. Value
About This Home
This home is located at 5647 Cape Vista Way, Salt Lake City, UT 84128 and is currently estimated at $492,312, approximately $349 per square foot. 5647 Cape Vista Way is a home located in Salt Lake County with nearby schools including Hillside Elementary School, Hunter Jr High School, and Hunter High School.
Ownership History
Date
Name
Owned For
Owner Type
Purchase Details
Closed on
Jun 28, 2018
Sold by
Nobility Investments Llc
Bought by
Bryson Andrew R and Bryson Pamela D
Current Estimated Value
Home Financials for this Owner
Home Financials are based on the most recent Mortgage that was taken out on this home.
Original Mortgage
$147,500
Outstanding Balance
$127,848
Interest Rate
4.6%
Mortgage Type
New Conventional
Estimated Equity
$364,464
Purchase Details
Closed on
Mar 5, 2013
Sold by
Tibbs Joseph M and Tibbs Natalie L
Bought by
Nobility Investments Llc
Home Financials for this Owner
Home Financials are based on the most recent Mortgage that was taken out on this home.
Original Mortgage
$173,000
Interest Rate
3.4%
Mortgage Type
New Conventional
Purchase Details
Closed on
Apr 28, 2008
Sold by
Dickson Jeff and Dickson Jessica
Bought by
Tibbs Natalie
Home Financials for this Owner
Home Financials are based on the most recent Mortgage that was taken out on this home.
Original Mortgage
$178,858
Interest Rate
5.8%
Mortgage Type
Purchase Money Mortgage
Purchase Details
Closed on
Apr 25, 2008
Sold by
Tibbs Natalie L
Bought by
Nobility Investments Llc
Home Financials for this Owner
Home Financials are based on the most recent Mortgage that was taken out on this home.
Original Mortgage
$178,858
Interest Rate
5.8%
Mortgage Type
Purchase Money Mortgage
Purchase Details
Closed on
Feb 8, 2006
Sold by
A + Properties Ltd
Bought by
Dickson Jeff and Dickson Jessica
Home Financials for this Owner
Home Financials are based on the most recent Mortgage that was taken out on this home.
Original Mortgage
$132,600
Interest Rate
6.87%
Mortgage Type
Stand Alone First
Purchase Details
Closed on
Jun 11, 2004
Sold by
Robinson Kristin
Bought by
A Properties Ltd
Purchase Details
Closed on
Oct 23, 2003
Sold by
Household Finance Corp Iii
Bought by
Robinson Kristin
Home Financials for this Owner
Home Financials are based on the most recent Mortgage that was taken out on this home.
Original Mortgage
$134,996
Interest Rate
5.94%
Mortgage Type
Purchase Money Mortgage
Purchase Details
Closed on
Jun 12, 2003
Sold by
Sorensen Jennifer M and Sorensen Bradley T
Bought by
Household Finance Corp Iii
Purchase Details
Closed on
Aug 1, 1995
Sold by
Sorensen Brad T and Sorensen Jennifer
Bought by
Sorensen Bradley T and Sorensen Jennifer M
Home Financials for this Owner
Home Financials are based on the most recent Mortgage that was taken out on this home.
Original Mortgage
$92,000
Interest Rate
7.61%
Mortgage Type
Purchase Money Mortgage
Create a Home Valuation Report for This Property
The Home Valuation Report is an in-depth analysis detailing your home's value as well as a comparison with similar homes in the area
Home Values in the Area
Average Home Value in this Area
Purchase History
| Date | Buyer | Sale Price | Title Company |
|---|---|---|---|
| Bryson Andrew R | -- | Bay National Title Co | |
| Nobility Investments Llc | -- | Pinnacle Title Co | |
| Tibbs Joseph M | -- | Pinnacle Title Co | |
| Tibbs Natalie | -- | None Available | |
| Nobility Investments Llc | -- | Cornerstone Title Ins Agcy L | |
| Dickson Jeff | -- | Atlas Title Murray | |
| A Properties Ltd | -- | -- | |
| Robinson Kristin | -- | Backman Stewart Title Svcs | |
| Household Finance Corp Iii | -- | United Title Services | |
| Sorensen Bradley T | -- | -- |
Source: Public Records
Mortgage History
| Date | Status | Borrower | Loan Amount |
|---|---|---|---|
| Open | Bryson Andrew R | $147,500 | |
| Previous Owner | Tibbs Joseph M | $173,000 | |
| Previous Owner | Tibbs Natalie | $178,858 | |
| Previous Owner | Nobility Investments Llc | $178,858 | |
| Previous Owner | Dickson Jeff | $132,600 | |
| Previous Owner | Robinson Kristin | $134,996 | |
| Previous Owner | Sorensen Bradley T | $92,000 |
Source: Public Records
Tax History Compared to Growth
Tax History
| Year | Tax Paid | Tax Assessment Tax Assessment Total Assessment is a certain percentage of the fair market value that is determined by local assessors to be the total taxable value of land and additions on the property. | Land | Improvement |
|---|---|---|---|---|
| 2025 | $2,609 | $447,300 | $127,200 | $320,100 |
| 2024 | $2,609 | $398,300 | $117,800 | $280,500 |
| 2023 | $2,609 | $364,100 | $113,300 | $250,800 |
| 2022 | $2,556 | $374,600 | $111,000 | $263,600 |
| 2021 | $2,357 | $310,400 | $85,400 | $225,000 |
| 2020 | $2,139 | $265,800 | $80,900 | $184,900 |
| 2019 | $2,301 | $275,800 | $66,700 | $209,100 |
| 2018 | $2,079 | $240,700 | $66,700 | $174,000 |
| 2017 | $1,885 | $221,900 | $66,700 | $155,200 |
| 2016 | $1,685 | $198,700 | $66,700 | $132,000 |
| 2015 | $1,633 | $183,400 | $68,700 | $114,700 |
| 2014 | $1,605 | $176,500 | $66,700 | $109,800 |
Source: Public Records
Map
Nearby Homes
- 5758 W 4510 S
- 4521 S Tarlton Cir
- 4509 Greystock Cir
- 5950 W 4700 S
- 5644 W 4360 S
- 5936 W Juniper Vista Dr
- 5944 W Vistas Haven Way Unit 34
- 5335 W Woodstep Ave
- 5960 W 4385 S
- 5905 W 4300 S
- 5269 W Cherrywood Ln
- 6081 W Haven Ridge Way
- 6085 W Autumn Vistas Dr
- 6104 W Peach Ridge Way
- 4345 S Long Valley Dr
- 4801 Townsend Way
- 6165 W Haven Ridge Way
- 5496 W Peggy Ln
- 4924 S 5455 W
- 4902 S Farah Dr
- 5647 W Cape Vista Way
- 5647 W Cape Vista S
- 5635 W Cape Vista Way
- 5659 Cape Vista Way
- 5659 W Cape Vista Way
- 5653 Cape Vista Way
- 5667 W Cape Vista Way
- 5627 Cape Vista Way
- 5667 Cape Vista Way
- 5652 Cape Vista Way
- 5652 W Cape Vista Way
- 4528 S 5630 W
- 5664 Cape Vista Way
- 5664 W Cape Vista Way
- 5679 Cape Vista Way
- 5613 Cape Vista Way
- 5613 W Cape Vista Way
- 5672 Cape Vista Way
- 4527 S 5630 W
- 5651 W 4510 S