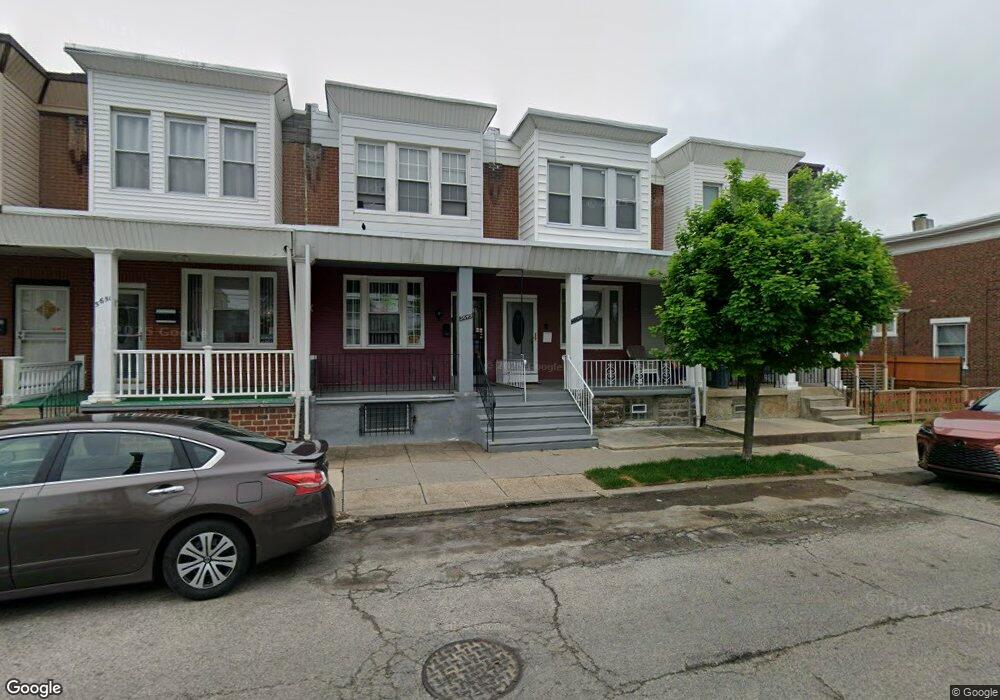
5647 N 2nd St Philadelphia, PA 19120
Olney NeighborhoodEstimated Value: $174,000 - $223,000
3
Beds
1
Bath
1,188
Sq Ft
$166/Sq Ft
Est. Value
About This Home
This home is located at 5647 N 2nd St, Philadelphia, PA 19120 and is currently estimated at $196,616, approximately $165 per square foot. 5647 N 2nd St is a home located in Philadelphia County with nearby schools including James R. Lowell Elementary School, Grover Washington Middle School, and Samuel Fels High School.
Ownership History
Date
Name
Owned For
Owner Type
Purchase Details
Closed on
Jul 30, 2013
Sold by
Ffrench Bromley
Bought by
Murray Garrick F
Current Estimated Value
Home Financials for this Owner
Home Financials are based on the most recent Mortgage that was taken out on this home.
Original Mortgage
$101,495
Interest Rate
4.5%
Mortgage Type
FHA
Purchase Details
Closed on
Jan 30, 2004
Sold by
Hud
Bought by
Ffrench Bromley
Home Financials for this Owner
Home Financials are based on the most recent Mortgage that was taken out on this home.
Original Mortgage
$25,000
Interest Rate
5.82%
Mortgage Type
Purchase Money Mortgage
Purchase Details
Closed on
Jun 24, 2002
Sold by
Hobbs Marguerite B and Aurora Loan Services Inc
Bought by
Hud
Purchase Details
Closed on
Nov 18, 1994
Sold by
You Hozling and Chea Keng
Bought by
Hobbs Marguerite B
Create a Home Valuation Report for This Property
The Home Valuation Report is an in-depth analysis detailing your home's value as well as a comparison with similar homes in the area
Home Values in the Area
Average Home Value in this Area
Purchase History
| Date | Buyer | Sale Price | Title Company |
|---|---|---|---|
| Murray Garrick F | $105,000 | None Available | |
| Ffrench Bromley | $35,100 | -- | |
| Hud | $30,000 | -- | |
| Hobbs Marguerite B | $46,000 | Penn Title Insurance Co |
Source: Public Records
Mortgage History
| Date | Status | Borrower | Loan Amount |
|---|---|---|---|
| Previous Owner | Murray Garrick F | $101,495 | |
| Previous Owner | Ffrench Bromley | $25,000 |
Source: Public Records
Tax History Compared to Growth
Tax History
| Year | Tax Paid | Tax Assessment Tax Assessment Total Assessment is a certain percentage of the fair market value that is determined by local assessors to be the total taxable value of land and additions on the property. | Land | Improvement |
|---|---|---|---|---|
| 2025 | $1,789 | $161,300 | $32,260 | $129,040 |
| 2024 | $1,789 | $161,300 | $32,260 | $129,040 |
| 2023 | $1,789 | $127,800 | $25,560 | $102,240 |
| 2022 | $1,398 | $127,800 | $25,560 | $102,240 |
| 2021 | $1,398 | $0 | $0 | $0 |
| 2020 | $1,398 | $0 | $0 | $0 |
| 2019 | $1,300 | $0 | $0 | $0 |
| 2018 | $1,356 | $0 | $0 | $0 |
| 2017 | $1,356 | $0 | $0 | $0 |
| 2016 | $1,356 | $0 | $0 | $0 |
| 2015 | $1,298 | $0 | $0 | $0 |
| 2014 | -- | $96,900 | $9,448 | $87,452 |
| 2012 | -- | $10,400 | $2,281 | $8,119 |
Source: Public Records
Map
Nearby Homes
- 229 W Chew Ave
- 5619 N American St
- 217 Furley St
- 163 W Chew Ave
- 5531 N 2nd St
- 5534 N American St
- 5814 N American St
- 5511 N 2nd St
- 308 W Grange Ave
- 249 W Calvert St
- 5835 N 3rd St
- 164 W Clarkson Ave
- 5832 N Mascher St
- 5648 N Lawrence St
- 5825 N 4th St
- 5834 N Hope St
- 5901 N 3rd St
- 5905 N 3rd St
- 5324 N 3rd St
- 5528 N Lawrence St
- 5645 N 2nd St
- 5649 N 2nd St
- 5651 N 2nd St
- 5643 N 2nd St
- 5653 N 2nd St
- 5641 N 2nd St
- 5637 N 2nd St
- 196 W Chew Ave
- 194 W Chew Ave
- 192 W Chew Ave
- 5629 N 2nd St Unit 31
- 5631 N Palethorp St
- 5634 N 2nd St
- 190 W Chew Ave
- 5630 N Palethorp St
- 5622 N 2nd St Unit B
- 5622 N 2nd St Unit 2
- 5622 N 2nd St Unit 1
- 5636 N 2nd St
- 188 W Chew Ave