Estimated Value: $378,000 - $459,000
4
Beds
2
Baths
1,850
Sq Ft
$219/Sq Ft
Est. Value
About This Home
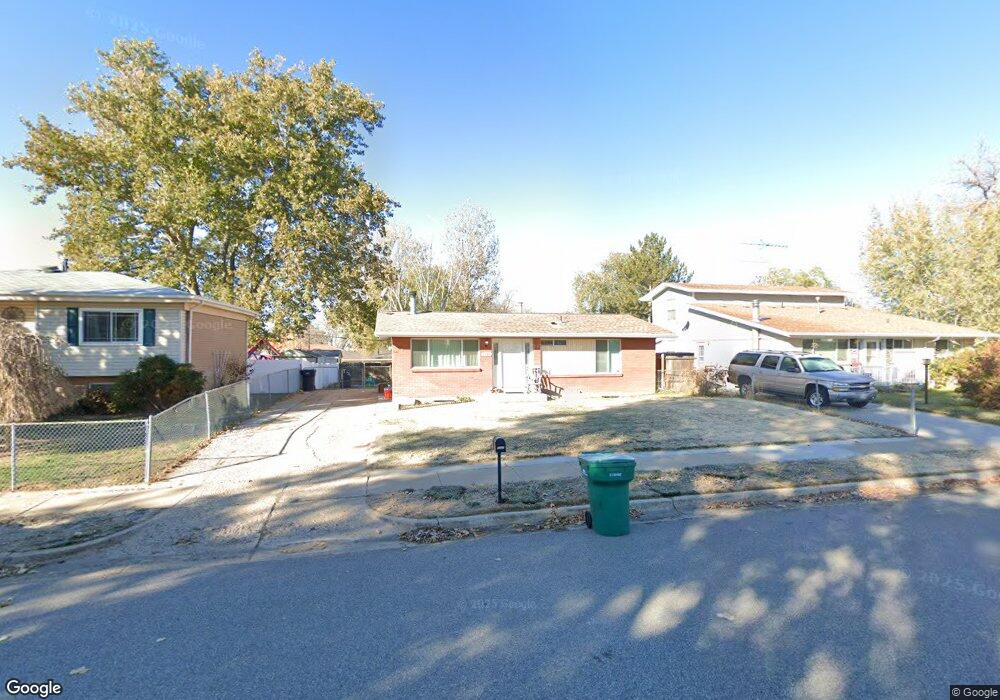
This home is located at 5647 S 2775 W, Roy, UT 84067 and is currently estimated at $404,960, approximately $218 per square foot. 5647 S 2775 W is a home located in Weber County with nearby schools including Roy Elementary School, Roy Junior High School, and Roy High School.
Ownership History
Date
Name
Owned For
Owner Type
Purchase Details
Closed on
Apr 26, 2023
Sold by
Edson Alec and Edson Michael
Bought by
Burbine Christopher and Burbine Stefanie
Current Estimated Value
Home Financials for this Owner
Home Financials are based on the most recent Mortgage that was taken out on this home.
Original Mortgage
$350,884
Outstanding Balance
$341,495
Interest Rate
6.6%
Mortgage Type
FHA
Estimated Equity
$63,465
Purchase Details
Closed on
Feb 26, 2020
Sold by
Kagie Aleshia L and Kagie Ian B
Bought by
Edson Alec and Edson Michaela
Home Financials for this Owner
Home Financials are based on the most recent Mortgage that was taken out on this home.
Original Mortgage
$232,221
Interest Rate
3.6%
Mortgage Type
VA
Purchase Details
Closed on
Jun 8, 2017
Sold by
Scott Luke S and Scott Mandi J
Bought by
Kagie Aleshia L and Kagie Ian B
Home Financials for this Owner
Home Financials are based on the most recent Mortgage that was taken out on this home.
Original Mortgage
$176,739
Interest Rate
4.4%
Mortgage Type
FHA
Purchase Details
Closed on
Jul 2, 2008
Sold by
Bargsley Tim G and Bargsley Lorna M
Bought by
Scott Luke S and Scott Mandi J
Create a Home Valuation Report for This Property
The Home Valuation Report is an in-depth analysis detailing your home's value as well as a comparison with similar homes in the area
Home Values in the Area
Average Home Value in this Area
Purchase History
| Date | Buyer | Sale Price | Title Company |
|---|---|---|---|
| Burbine Christopher | -- | Us Title | |
| Edson Alec | -- | Stewart Title Ins Agency Of | |
| Kagie Aleshia L | -- | Us Title Insurance Agency | |
| Scott Luke S | -- | Gt Title Kaysville |
Source: Public Records
Mortgage History
| Date | Status | Borrower | Loan Amount |
|---|---|---|---|
| Open | Burbine Christopher | $350,884 | |
| Previous Owner | Edson Alec | $232,221 | |
| Previous Owner | Kagie Aleshia L | $176,739 |
Source: Public Records
Tax History
| Year | Tax Paid | Tax Assessment Tax Assessment Total Assessment is a certain percentage of the fair market value that is determined by local assessors to be the total taxable value of land and additions on the property. | Land | Improvement |
|---|---|---|---|---|
| 2025 | $2,230 | $346,595 | $116,169 | $230,426 |
| 2024 | $2,178 | $187,549 | $63,906 | $123,643 |
| 2023 | $2,256 | $196,350 | $64,894 | $131,456 |
| 2022 | $2,137 | $190,301 | $53,730 | $136,571 |
| 2021 | $1,841 | $270,000 | $63,339 | $206,661 |
| 2020 | $1,729 | $233,000 | $63,339 | $169,661 |
| 2019 | $1,617 | $204,000 | $38,660 | $165,340 |
| 2018 | $1,492 | $176,000 | $35,740 | $140,260 |
| 2017 | $1,355 | $148,331 | $34,800 | $113,531 |
| 2016 | $1,286 | $75,431 | $18,898 | $56,533 |
| 2015 | $1,086 | $63,728 | $18,898 | $44,830 |
| 2014 | $1,050 | $60,596 | $18,898 | $41,698 |
Source: Public Records
Map
Nearby Homes
Your Personal Tour Guide
Ask me questions while you tour the home.