Estimated Value: $409,694 - $434,000
3
Beds
2
Baths
1,656
Sq Ft
$254/Sq Ft
Est. Value
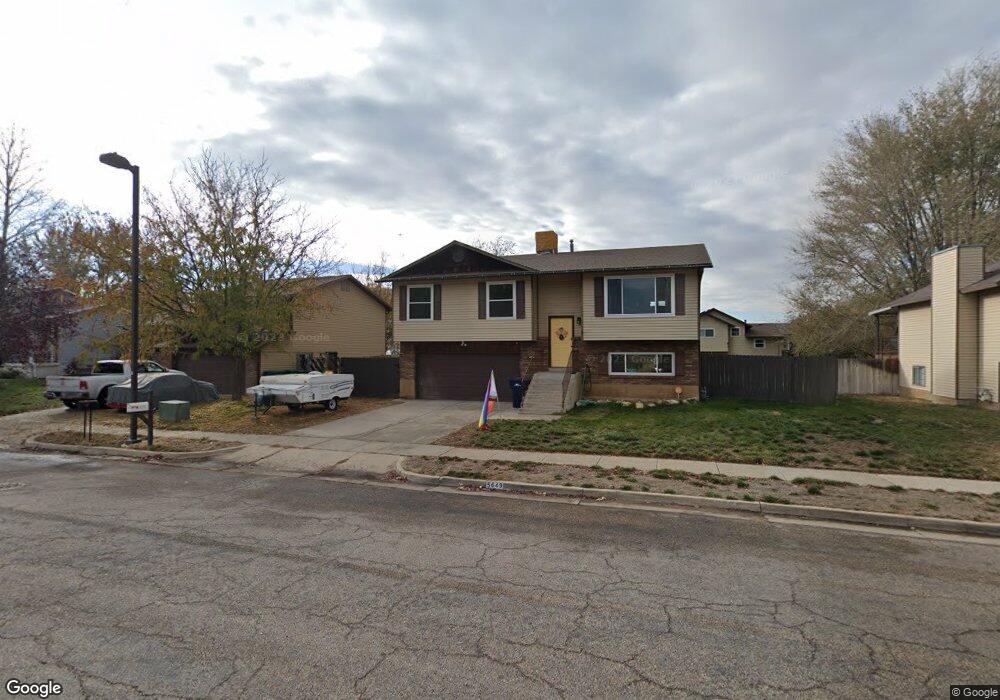
About This Home
This home is located at 5649 S 2950 W, Roy, UT 84067 and is currently estimated at $420,674, approximately $254 per square foot. 5649 S 2950 W is a home located in Weber County with nearby schools including Roy Elementary School, Roy Junior High School, and Roy High School.
Ownership History
Date
Name
Owned For
Owner Type
Purchase Details
Closed on
Apr 23, 2020
Sold by
Hansen Danielle
Bought by
Harrison Garcia Kurt David
Current Estimated Value
Home Financials for this Owner
Home Financials are based on the most recent Mortgage that was taken out on this home.
Original Mortgage
$260,200
Outstanding Balance
$228,032
Interest Rate
3.3%
Mortgage Type
FHA
Estimated Equity
$192,642
Purchase Details
Closed on
Mar 13, 2020
Sold by
Sneddon Marlene A
Bought by
Hansen Danielle
Home Financials for this Owner
Home Financials are based on the most recent Mortgage that was taken out on this home.
Original Mortgage
$260,200
Outstanding Balance
$228,032
Interest Rate
3.3%
Mortgage Type
FHA
Estimated Equity
$192,642
Purchase Details
Closed on
May 14, 1999
Sold by
Sneddon Brad M
Bought by
Sneddon Marlene A and Vega Consuelo C
Home Financials for this Owner
Home Financials are based on the most recent Mortgage that was taken out on this home.
Original Mortgage
$105,300
Interest Rate
8.49%
Create a Home Valuation Report for This Property
The Home Valuation Report is an in-depth analysis detailing your home's value as well as a comparison with similar homes in the area
Home Values in the Area
Average Home Value in this Area
Purchase History
| Date | Buyer | Sale Price | Title Company |
|---|---|---|---|
| Harrison Garcia Kurt David | -- | North Amer Ttl Ut Bolntiful | |
| Hansen Danielle | -- | None Available | |
| Sneddon Marlene A | -- | Associated Title |
Source: Public Records
Mortgage History
| Date | Status | Borrower | Loan Amount |
|---|---|---|---|
| Open | Harrison Garcia Kurt David | $260,200 | |
| Previous Owner | Sneddon Marlene A | $105,300 |
Source: Public Records
Tax History
| Year | Tax Paid | Tax Assessment Tax Assessment Total Assessment is a certain percentage of the fair market value that is determined by local assessors to be the total taxable value of land and additions on the property. | Land | Improvement |
|---|---|---|---|---|
| 2025 | $2,504 | $394,900 | $111,997 | $282,903 |
| 2024 | $2,442 | $213,399 | $61,598 | $151,801 |
| 2023 | $2,296 | $200,200 | $63,811 | $136,389 |
| 2022 | $2,473 | $223,850 | $55,037 | $168,813 |
| 2021 | $1,949 | $288,000 | $71,367 | $216,633 |
| 2020 | $1,815 | $246,000 | $71,367 | $174,633 |
| 2019 | $382 | $216,000 | $42,082 | $173,918 |
| 2018 | $357 | $189,000 | $40,146 | $148,854 |
| 2017 | $331 | $163,000 | $40,146 | $122,854 |
| 2016 | $836 | $89,085 | $20,272 | $68,813 |
| 2015 | $741 | $78,656 | $20,272 | $58,384 |
| 2014 | $746 | $78,656 | $20,272 | $58,384 |
Source: Public Records
Map
Nearby Homes
Your Personal Tour Guide
Ask me questions while you tour the home.