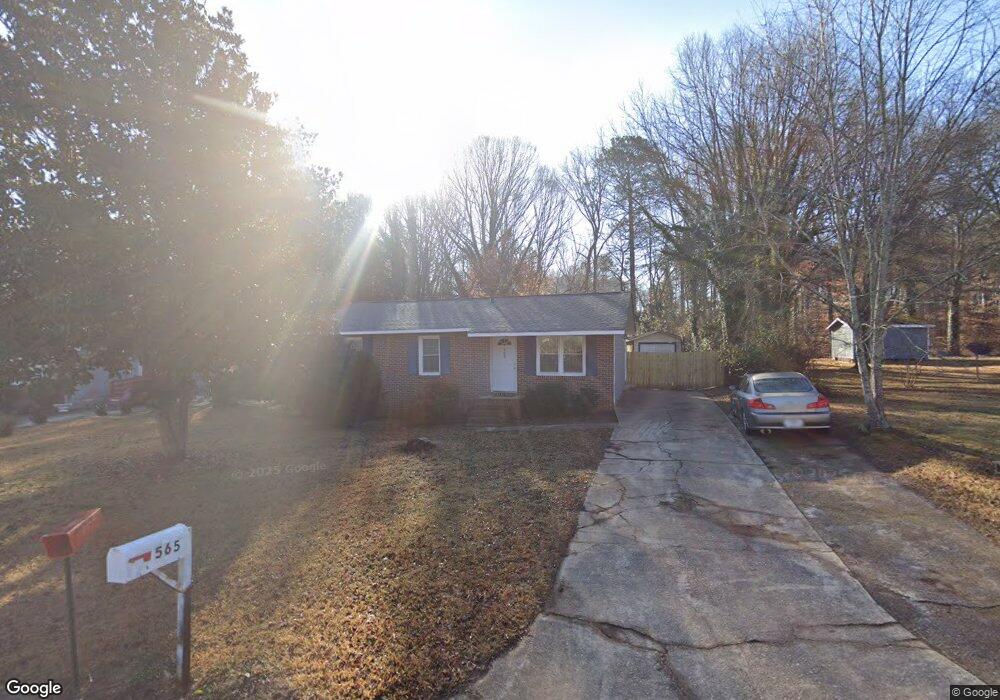
565 Aubrey Dr Bogart, GA 30622
Estimated Value: $196,000 - $220,906
3
Beds
1
Bath
1,040
Sq Ft
$197/Sq Ft
Est. Value
About This Home
This home is located at 565 Aubrey Dr, Bogart, GA 30622 and is currently estimated at $204,477, approximately $196 per square foot. 565 Aubrey Dr is a home located in Clarke County with nearby schools including Cleveland Road Elementary School, Burney-Harris-Lyons Middle School, and Clarke Central High School.
Ownership History
Date
Name
Owned For
Owner Type
Purchase Details
Closed on
Feb 23, 2018
Sold by
Davenport Ora
Bought by
Sheats David
Current Estimated Value
Home Financials for this Owner
Home Financials are based on the most recent Mortgage that was taken out on this home.
Original Mortgage
$78,551
Outstanding Balance
$68,449
Interest Rate
5.12%
Mortgage Type
FHA
Estimated Equity
$136,028
Purchase Details
Closed on
Jul 27, 2004
Sold by
Adio Properties Llc
Bought by
Davenport Ora
Purchase Details
Closed on
Oct 15, 2001
Sold by
Simpson Anthony W and Simpson Stacey L
Bought by
Adio Properties Llc
Purchase Details
Closed on
Apr 17, 2001
Sold by
Madden Michael P and Madden Vance W
Bought by
Simpson Anthony W and Simpso Stacey L
Purchase Details
Closed on
May 14, 1999
Sold by
Madden Michael P Renae A Madden and Madden Vance
Bought by
Madden Michael P and Snow Vance W
Purchase Details
Closed on
Dec 15, 1997
Sold by
Walker Troy D
Bought by
Madden Michael P Renae A Madden and Madden V
Create a Home Valuation Report for This Property
The Home Valuation Report is an in-depth analysis detailing your home's value as well as a comparison with similar homes in the area
Home Values in the Area
Average Home Value in this Area
Purchase History
| Date | Buyer | Sale Price | Title Company |
|---|---|---|---|
| Sheats David | $80,000 | -- | |
| Davenport Ora | $65,000 | -- | |
| Adio Properties Llc | -- | -- | |
| Simpson Anthony W | $54,500 | -- | |
| Madden Michael P | -- | -- | |
| Madden Michael P Renae A Madden | $30,000 | -- |
Source: Public Records
Mortgage History
| Date | Status | Borrower | Loan Amount |
|---|---|---|---|
| Open | Sheats David | $78,551 |
Source: Public Records
Tax History Compared to Growth
Tax History
| Year | Tax Paid | Tax Assessment Tax Assessment Total Assessment is a certain percentage of the fair market value that is determined by local assessors to be the total taxable value of land and additions on the property. | Land | Improvement |
|---|---|---|---|---|
| 2024 | $1,882 | $54,514 | $12,000 | $42,514 |
| 2023 | $1,704 | $47,102 | $10,400 | $36,702 |
| 2022 | $1,366 | $42,824 | $10,400 | $32,424 |
| 2021 | $1,149 | $34,101 | $8,000 | $26,101 |
| 2020 | $1,122 | $33,304 | $8,000 | $25,304 |
| 2019 | $1,084 | $31,915 | $8,000 | $23,915 |
| 2018 | $810 | $23,844 | $7,200 | $16,644 |
| 2017 | $470 | $24,634 | $7,200 | $17,434 |
| 2016 | $451 | $23,298 | $7,200 | $16,098 |
| 2015 | $458 | $23,472 | $7,200 | $16,272 |
| 2014 | $471 | $23,820 | $7,200 | $16,620 |
Source: Public Records
Map
Nearby Homes