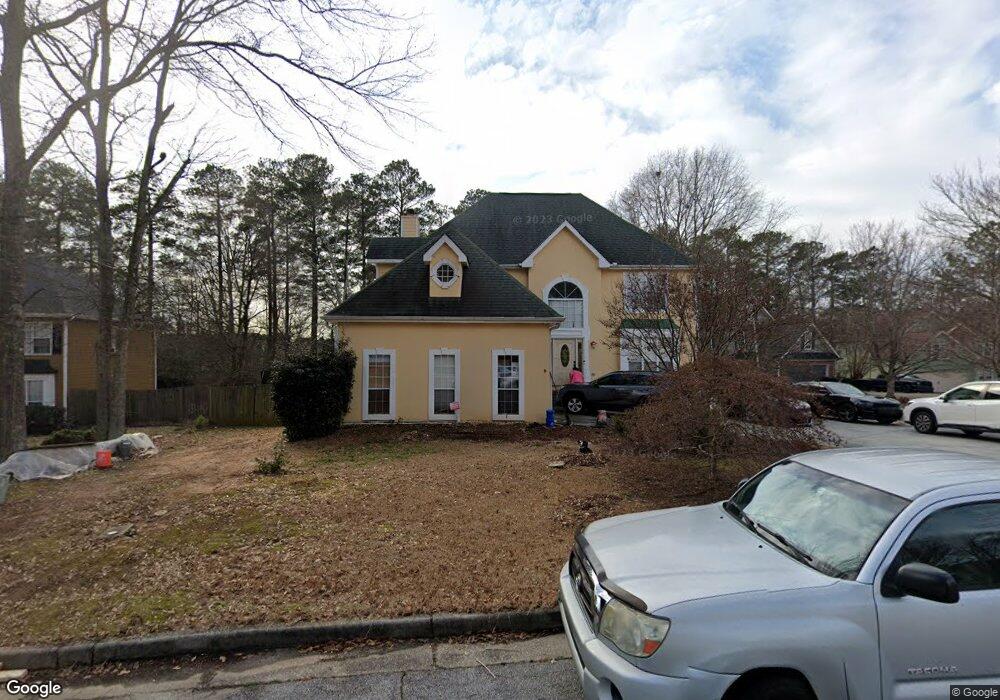
565 Briar Run Ct Loganville, GA 30052
Estimated Value: $382,000 - $447,488
5
Beds
4
Baths
2,563
Sq Ft
$163/Sq Ft
Est. Value
About This Home
This home is located at 565 Briar Run Ct, Loganville, GA 30052 and is currently estimated at $418,872, approximately $163 per square foot. 565 Briar Run Ct is a home located in Gwinnett County with nearby schools including Magill Elementary School, Grace Snell Middle School, and South Gwinnett High School.
Ownership History
Date
Name
Owned For
Owner Type
Purchase Details
Closed on
Aug 13, 2008
Sold by
Bono Edwin
Bought by
Bono Edwin and Bono Elizabeth
Current Estimated Value
Home Financials for this Owner
Home Financials are based on the most recent Mortgage that was taken out on this home.
Original Mortgage
$226,000
Outstanding Balance
$150,354
Interest Rate
6.61%
Mortgage Type
VA
Estimated Equity
$268,518
Purchase Details
Closed on
Jul 15, 2004
Sold by
Corradino Paul A and Corradino Teresa
Bought by
Driggers Chad and Driggers Heather
Home Financials for this Owner
Home Financials are based on the most recent Mortgage that was taken out on this home.
Original Mortgage
$42,950
Interest Rate
6.22%
Mortgage Type
Unknown
Purchase Details
Closed on
Sep 7, 1995
Sold by
Prestige Home Bldrs
Bought by
Corradino Paul A Teresa
Create a Home Valuation Report for This Property
The Home Valuation Report is an in-depth analysis detailing your home's value as well as a comparison with similar homes in the area
Home Values in the Area
Average Home Value in this Area
Purchase History
| Date | Buyer | Sale Price | Title Company |
|---|---|---|---|
| Bono Edwin | $226,000 | -- | |
| Bono Edwin | $226,000 | -- | |
| Driggers Chad | $214,900 | -- | |
| Corradino Paul A Teresa | $152,100 | -- |
Source: Public Records
Mortgage History
| Date | Status | Borrower | Loan Amount |
|---|---|---|---|
| Open | Bono Edwin | $226,000 | |
| Previous Owner | Driggers Chad | $42,950 | |
| Previous Owner | Driggers Chad | $171,920 | |
| Closed | Corradino Paul A Teresa | $0 |
Source: Public Records
Tax History Compared to Growth
Tax History
| Year | Tax Paid | Tax Assessment Tax Assessment Total Assessment is a certain percentage of the fair market value that is determined by local assessors to be the total taxable value of land and additions on the property. | Land | Improvement |
|---|---|---|---|---|
| 2024 | $1,174 | $174,120 | $30,000 | $144,120 |
| 2023 | $1,174 | $174,280 | $29,680 | $144,600 |
| 2022 | $0 | $161,080 | $22,000 | $139,080 |
| 2021 | $330 | $116,360 | $14,000 | $102,360 |
| 2020 | $663 | $103,520 | $12,000 | $91,520 |
| 2019 | $663 | $103,520 | $12,000 | $91,520 |
| 2018 | $663 | $100,320 | $12,000 | $88,320 |
| 2016 | $605 | $84,840 | $10,000 | $74,840 |
| 2015 | $482 | $66,240 | $10,000 | $56,240 |
| 2014 | $495 | $66,240 | $10,000 | $56,240 |
Source: Public Records
Map
Nearby Homes
- 922 Lakeside Ct
- 910 Lakeside Ct
- 110 Slate Ridge Ln
- 241 Fox Run
- 4085 Hogans Mill Ln
- 750 Old Loganville Rd SW
- 452 Crested View Dr
- 232 Rockingham Dr
- 443 Rhett Dr
- 433 Rhett Dr
- 737 Wilkes Dr
- 3865 Weeping Willow Ln
- 3810 Weeping Willow Ln
- 716 Wilkes Dr
- 4441 Fiddlers Bend Unit 4
- 256 Teresa Ln
- 571 Bradford Place Ct
- 555 Briar Run Ct
- 575 Briar Run Ct
- 585 Briar Run Ct
- 585 Briar Run Ct Unit 129
- 551 Briar Run Ct
- 716 Manor Ridge Dr Unit 1
- 550 Briar Run Ct
- 570 Briar Run Ct
- 714 Manor Ridge Dr
- 718 Manor Ridge Dr
- 580 Briar Run Ct 0
- 580 Briar Run Court 0
- 549 Briar Run Ct
- 595 Briar Run Ct
- 580 Briar Run Ct
- 712 Manor Ridge Dr
- 547 Briar Run Ct
- 545 Briar Run Ct
- 530 Briar Run Ct
- 590 Briar Run Ct