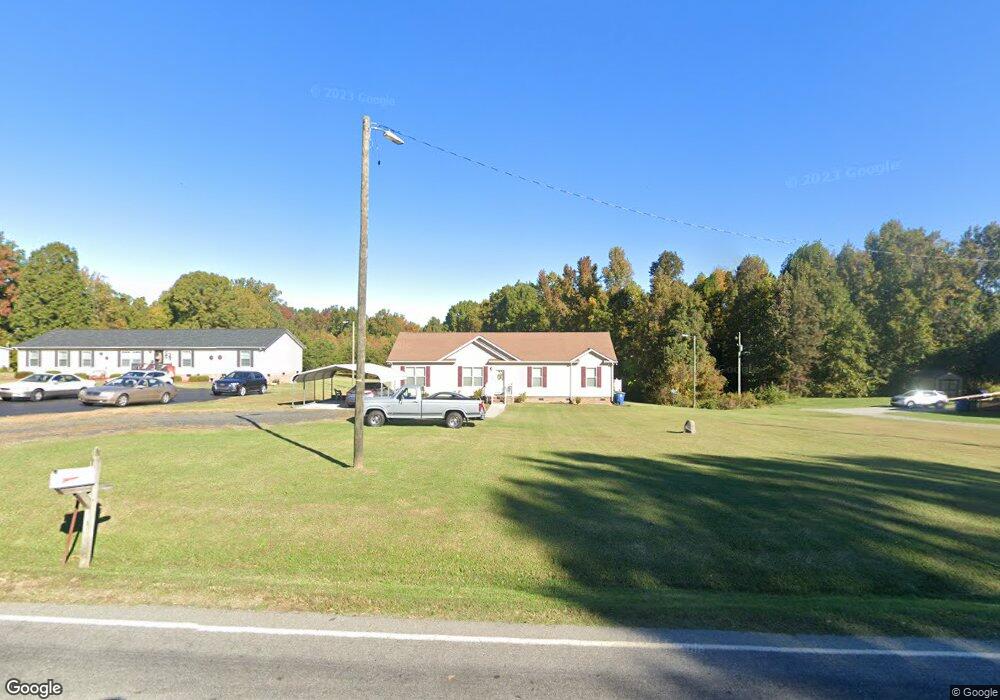
565 Candy Creek Rd Reidsville, NC 27320
Estimated Value: $262,000 - $298,000
3
Beds
2
Baths
1,792
Sq Ft
$154/Sq Ft
Est. Value
About This Home
This home is located at 565 Candy Creek Rd, Reidsville, NC 27320 and is currently estimated at $276,333, approximately $154 per square foot. 565 Candy Creek Rd is a home located in Rockingham County with nearby schools including Williamsburg Elementary School, Reidsville High School, and Reidsville Middle School.
Ownership History
Date
Name
Owned For
Owner Type
Purchase Details
Closed on
Jun 5, 2008
Sold by
Cmh Homes Inc
Bought by
Clay Ricky L and Clay Bernice
Current Estimated Value
Home Financials for this Owner
Home Financials are based on the most recent Mortgage that was taken out on this home.
Original Mortgage
$170,327
Outstanding Balance
$109,130
Interest Rate
6.02%
Mortgage Type
FHA
Estimated Equity
$167,203
Purchase Details
Closed on
Jun 2, 2008
Sold by
Brown & Whary Llc
Bought by
Cmh Homes Inc
Home Financials for this Owner
Home Financials are based on the most recent Mortgage that was taken out on this home.
Original Mortgage
$170,327
Outstanding Balance
$109,130
Interest Rate
6.02%
Mortgage Type
FHA
Estimated Equity
$167,203
Purchase Details
Closed on
Jan 18, 2008
Sold by
Griffin Harry L and Griffin Mary C
Bought by
Cmh Homes Inc
Create a Home Valuation Report for This Property
The Home Valuation Report is an in-depth analysis detailing your home's value as well as a comparison with similar homes in the area
Home Values in the Area
Average Home Value in this Area
Purchase History
| Date | Buyer | Sale Price | Title Company |
|---|---|---|---|
| Clay Ricky L | $173,000 | None Available | |
| Cmh Homes Inc | $16,500 | None Available | |
| Cmh Homes Inc | $19,000 | None Available |
Source: Public Records
Mortgage History
| Date | Status | Borrower | Loan Amount |
|---|---|---|---|
| Open | Clay Ricky L | $170,327 |
Source: Public Records
Tax History Compared to Growth
Tax History
| Year | Tax Paid | Tax Assessment Tax Assessment Total Assessment is a certain percentage of the fair market value that is determined by local assessors to be the total taxable value of land and additions on the property. | Land | Improvement |
|---|---|---|---|---|
| 2025 | $1,635 | $240,380 | $22,000 | $218,380 |
| 2024 | $1,593 | $240,380 | $22,000 | $218,380 |
| 2023 | $1,593 | $153,957 | $20,000 | $133,957 |
| 2022 | $1,239 | $153,957 | $20,000 | $133,957 |
| 2021 | $1,239 | $153,957 | $20,000 | $133,957 |
| 2020 | $1,239 | $153,957 | $20,000 | $133,957 |
| 2019 | $1,239 | $153,957 | $20,000 | $133,957 |
| 2018 | $1,211 | $150,234 | $30,000 | $120,234 |
| 2017 | $1,211 | $150,234 | $30,000 | $120,234 |
| 2015 | $1,223 | $150,234 | $30,000 | $120,234 |
| 2014 | $1,211 | $150,234 | $30,000 | $120,234 |
Source: Public Records
Map
Nearby Homes
- 0 Candy Creek Rd
- 5765 Chrismon Rd
- 5767 Chrismon Rd
- 336 Jones Lake Rd
- 0 Jones Lake Rd
- 122 Clebourne Ln
- 8061 Old Reidsville Rd
- 7848 Jackson School Rd
- 000 Sunset View Ct
- 0 Speedway Dr
- 7409 Friendship Church Rd
- 119 Hillcrest Rd
- 5554 Friendship Glen Dr
- 7347 Sun Harbor Dr
- 5423 Pine Level Dr
- 7345 Sun Harbor Dr
- 5409 Pine Level Dr
- 3349 Nc Highway 87
- 14.45± Acres Off Pritchett Rd
- 276 Brann Rd
- 555 Candy Creek Rd
- 593 Candy Creek Rd
- 543 Candy Creek Rd
- 605 Candy Creek Rd
- 582 Candy Creek Rd
- 529 Candy Creek Rd
- 544 Candy Creek Rd
- 501 Candy Creek Rd
- 598 Candy Creek Rd
- 617 Candy Creek Rd
- 562 Candy Creek Rd
- 180 Rr 10
- 519 Candy Creek Rd
- 610 Candy Creek Rd
- 530 Candy Creek Rd
- 635 Candy Creek Rd
- 620 Candy Creek Rd
- 620 Candy Creek Rd
- 514 Candy Creek Rd
- 134 Andrew Dr