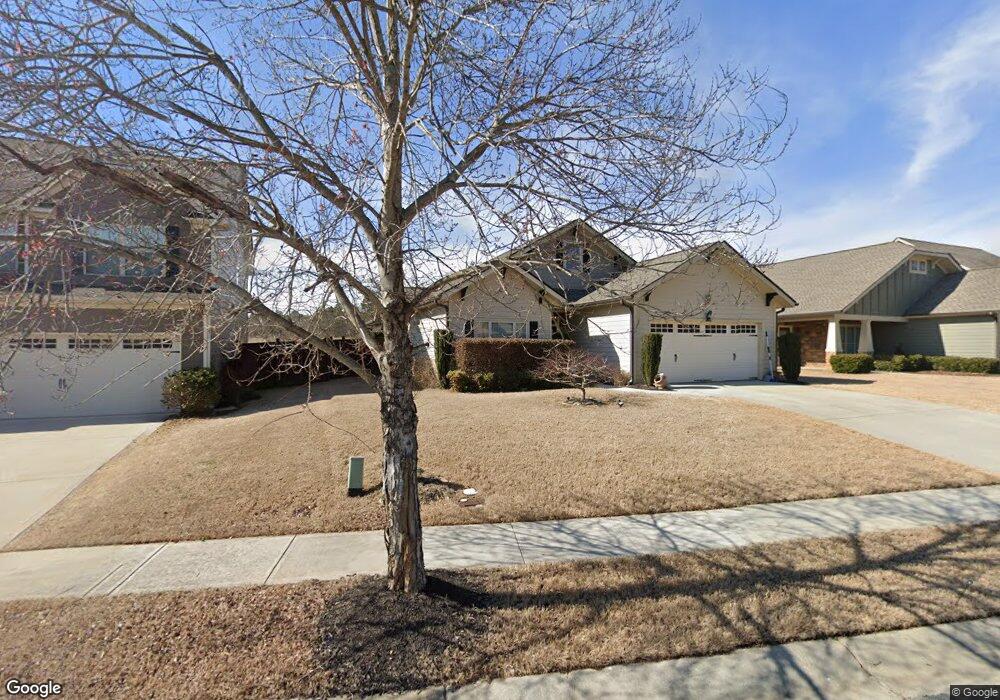
565 Cottage Loop Pendergrass, GA 30567
Estimated Value: $318,883 - $350,000
3
Beds
2
Baths
1,723
Sq Ft
$197/Sq Ft
Est. Value
About This Home
This home is located at 565 Cottage Loop, Pendergrass, GA 30567 and is currently estimated at $339,471, approximately $197 per square foot. 565 Cottage Loop is a home located in Jackson County with nearby schools including North Jackson Elementary School, West Jackson Middle School, and Jackson County High School.
Ownership History
Date
Name
Owned For
Owner Type
Purchase Details
Closed on
Feb 23, 2021
Sold by
Miller Cheryl Lynn
Bought by
Fisher Cheryl Lynn
Current Estimated Value
Home Financials for this Owner
Home Financials are based on the most recent Mortgage that was taken out on this home.
Original Mortgage
$170,000
Outstanding Balance
$120,781
Interest Rate
2.7%
Mortgage Type
New Conventional
Estimated Equity
$218,690
Purchase Details
Closed on
Dec 22, 2010
Sold by
Security Builders Inc
Bought by
Miller Cheryl Lynn
Home Financials for this Owner
Home Financials are based on the most recent Mortgage that was taken out on this home.
Original Mortgage
$134,900
Interest Rate
4.4%
Mortgage Type
New Conventional
Purchase Details
Closed on
Aug 18, 2008
Sold by
G T Property Development L
Bought by
Security Builders Inc
Purchase Details
Closed on
Feb 22, 2005
Sold by
Tolbert Glenda
Bought by
G T Property Development Llc
Purchase Details
Closed on
Aug 3, 2001
Sold by
Estate Of Glenn Gee
Bought by
Tolbert Glenda G
Create a Home Valuation Report for This Property
The Home Valuation Report is an in-depth analysis detailing your home's value as well as a comparison with similar homes in the area
Home Values in the Area
Average Home Value in this Area
Purchase History
| Date | Buyer | Sale Price | Title Company |
|---|---|---|---|
| Fisher Cheryl Lynn | -- | -- | |
| Miller Cheryl Lynn | $149,900 | -- | |
| Security Builders Inc | $38,000 | -- | |
| G T Property Development Llc | -- | -- | |
| Tolbert Glenda G | -- | -- |
Source: Public Records
Mortgage History
| Date | Status | Borrower | Loan Amount |
|---|---|---|---|
| Open | Fisher Cheryl Lynn | $170,000 | |
| Previous Owner | Miller Cheryl Lynn | $134,900 |
Source: Public Records
Tax History
| Year | Tax Paid | Tax Assessment Tax Assessment Total Assessment is a certain percentage of the fair market value that is determined by local assessors to be the total taxable value of land and additions on the property. | Land | Improvement |
|---|---|---|---|---|
| 2025 | $3,712 | $125,800 | $24,600 | $101,200 |
| 2024 | $3,712 | $125,800 | $24,600 | $101,200 |
| 2023 | $3,737 | $114,640 | $24,600 | $90,040 |
| 2022 | $3,010 | $95,560 | $24,600 | $70,960 |
| 2021 | $2,758 | $86,960 | $16,000 | $70,960 |
| 2020 | $2,540 | $73,920 | $16,000 | $57,920 |
| 2019 | $2,208 | $63,400 | $8,000 | $55,400 |
| 2018 | $2,131 | $60,720 | $8,000 | $52,720 |
| 2017 | $1,882 | $53,427 | $8,000 | $45,427 |
| 2016 | $1,891 | $53,427 | $8,000 | $45,427 |
| 2015 | $1,899 | $53,427 | $8,000 | $45,427 |
| 2014 | $1,740 | $48,761 | $6,000 | $42,761 |
| 2013 | -- | $48,760 | $6,000 | $42,760 |
Source: Public Records
Map
Nearby Homes
- 225 Brooks Village Dr
- 1012 Highway 332
- 72 Hidden Pines Cir
- 906 Independence Ave
- 735 Walnut Creek Cir
- 410 Winter
- 1028 Sope Creek Cir
- 1075 Sope Creek Cir
- 954 Sope Creek Cir
- 249 Seasons Valley
- 297 Seasons Valley
- 222 Seasons Valley
- 331 Merigold Way
- 837 Summer Springs Ct
- 110 Pendergrass Farms Cir
- 723 Independence Ave
- 170 Sope Creek Cir
- 443 Morgan Creek Rd
- 1042 Sope Creek Cir
- 1039 Sope Creek Cir
- 555 Cottage Loop Unit 111
- 555 Cottage Loop
- 205 Cottage Loop
- 595 Cottage Loop Unit 108
- 595 Cottage Loop
- 545 Cottage Loop Unit 112
- 545 Cottage Loop
- 605 Cottage Loop Unit 107
- 605 Cottage Loop
- 535 Cottage Loop Unit 113
- 0 Brooks Loop
- 525 Cottage Loop
- 525 Cottage Loop Unit 114
- 615 Cottage Loop Unit 106
- 615 Cottage Loop
- 534 Cottage Loop Unit 95
- 534 Cottage Loop
- 574 Cottage Loop #99
- 554 Cottage Loop Unit 97
- 554 Cottage Loop
Your Personal Tour Guide
Ask me questions while you tour the home.