Estimated Value: $570,000 - $707,000
4
Beds
3
Baths
3,550
Sq Ft
$178/Sq Ft
Est. Value
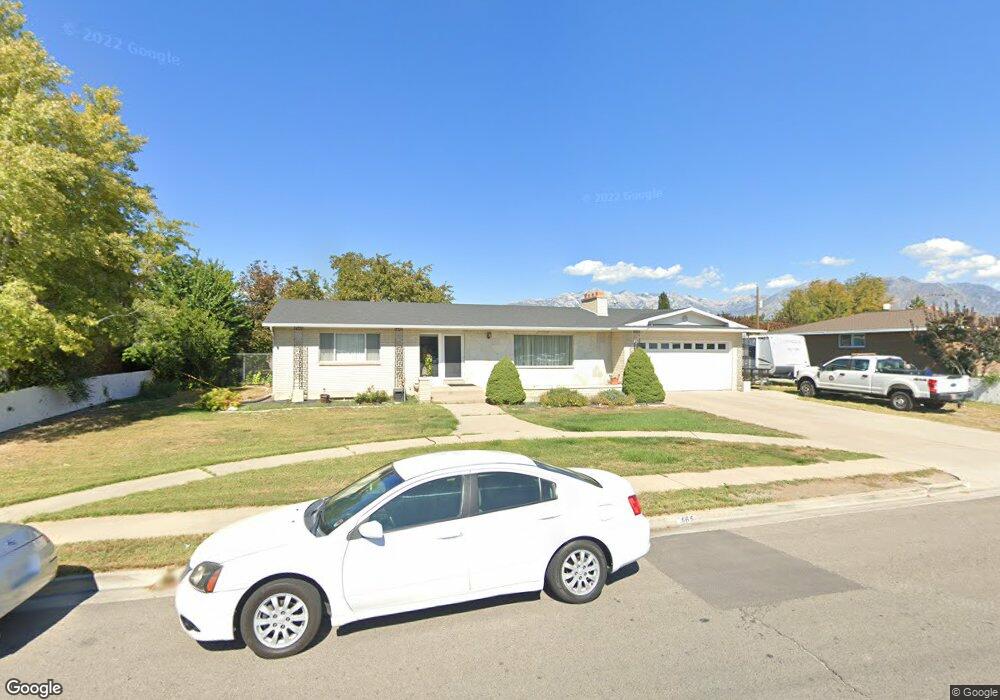
About This Home
This home is located at 565 E 300 N, Lehi, UT 84043 and is currently estimated at $631,947, approximately $178 per square foot. 565 E 300 N is a home located in Utah County with nearby schools including Lehi Elementary School, Lehi Junior High School, and Lehi High School.
Ownership History
Date
Name
Owned For
Owner Type
Purchase Details
Closed on
Jun 15, 2015
Sold by
Votaw Brian
Bought by
Bright David S and Bright Stacey L
Current Estimated Value
Home Financials for this Owner
Home Financials are based on the most recent Mortgage that was taken out on this home.
Original Mortgage
$275,500
Outstanding Balance
$210,787
Interest Rate
3.81%
Mortgage Type
New Conventional
Estimated Equity
$421,160
Purchase Details
Closed on
Apr 24, 2006
Sold by
Peterson Alma Kent
Bought by
Votaw Brian
Home Financials for this Owner
Home Financials are based on the most recent Mortgage that was taken out on this home.
Original Mortgage
$250,000
Interest Rate
6.29%
Mortgage Type
Fannie Mae Freddie Mac
Create a Home Valuation Report for This Property
The Home Valuation Report is an in-depth analysis detailing your home's value as well as a comparison with similar homes in the area
Home Values in the Area
Average Home Value in this Area
Purchase History
| Date | Buyer | Sale Price | Title Company |
|---|---|---|---|
| Bright David S | -- | Inwest Title | |
| Votaw Brian | -- | Signature Title Insurance A |
Source: Public Records
Mortgage History
| Date | Status | Borrower | Loan Amount |
|---|---|---|---|
| Open | Bright David S | $275,500 | |
| Previous Owner | Votaw Brian | $250,000 |
Source: Public Records
Tax History
| Year | Tax Paid | Tax Assessment Tax Assessment Total Assessment is a certain percentage of the fair market value that is determined by local assessors to be the total taxable value of land and additions on the property. | Land | Improvement |
|---|---|---|---|---|
| 2025 | $2,321 | $298,925 | -- | -- |
| 2024 | $2,321 | $271,645 | $0 | $0 |
| 2023 | $2,100 | $266,860 | $0 | $0 |
| 2022 | $2,336 | $287,705 | $0 | $0 |
| 2021 | $2,088 | $388,800 | $123,300 | $265,500 |
| 2020 | $1,968 | $362,300 | $114,200 | $248,100 |
| 2019 | $1,893 | $362,300 | $114,200 | $248,100 |
| 2018 | $1,793 | $324,300 | $104,400 | $219,900 |
| 2017 | $1,701 | $163,570 | $0 | $0 |
| 2016 | $1,602 | $142,945 | $0 | $0 |
| 2015 | $1,545 | $130,900 | $0 | $0 |
| 2014 | $1,400 | $117,920 | $0 | $0 |
Source: Public Records
Map
Nearby Homes
Your Personal Tour Guide
Ask me questions while you tour the home.