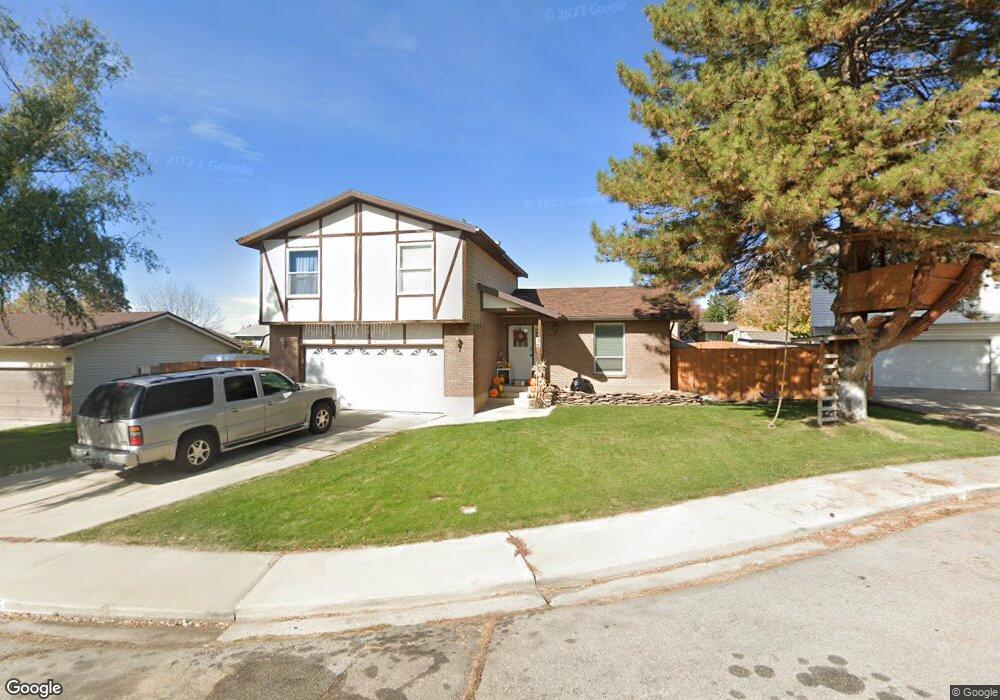
565 E 870 S Pleasant Grove, UT 84062
Estimated Value: $490,000 - $618,000
5
Beds
3
Baths
2,370
Sq Ft
$224/Sq Ft
Est. Value
About This Home
This home is located at 565 E 870 S, Pleasant Grove, UT 84062 and is currently estimated at $531,431, approximately $224 per square foot. 565 E 870 S is a home located in Utah County with nearby schools including Lindon Elementary School, Oak Canyon Junior High School, and Pleasant Grove High School.
Ownership History
Date
Name
Owned For
Owner Type
Purchase Details
Closed on
Jun 13, 2014
Sold by
Black B Lyle and Black Shauna B
Bought by
Randall Shelly and Randall Jeremie
Current Estimated Value
Home Financials for this Owner
Home Financials are based on the most recent Mortgage that was taken out on this home.
Original Mortgage
$199,180
Outstanding Balance
$148,894
Interest Rate
3.75%
Mortgage Type
FHA
Estimated Equity
$382,537
Purchase Details
Closed on
Dec 3, 2007
Sold by
Black B Lyle and Black Shauna B
Bought by
Black B Lyle and Black Shauna B
Home Financials for this Owner
Home Financials are based on the most recent Mortgage that was taken out on this home.
Original Mortgage
$205,000
Interest Rate
6.3%
Mortgage Type
New Conventional
Purchase Details
Closed on
Aug 24, 1996
Sold by
Bayles Vicki
Bought by
Black B Lyle and Black Shauna B
Home Financials for this Owner
Home Financials are based on the most recent Mortgage that was taken out on this home.
Original Mortgage
$25,518
Interest Rate
8.23%
Create a Home Valuation Report for This Property
The Home Valuation Report is an in-depth analysis detailing your home's value as well as a comparison with similar homes in the area
Home Values in the Area
Average Home Value in this Area
Purchase History
| Date | Buyer | Sale Price | Title Company |
|---|---|---|---|
| Randall Shelly | -- | United West Title | |
| Black B Lyle | -- | Inwest Title Services Inc | |
| Black B Lyle | -- | -- |
Source: Public Records
Mortgage History
| Date | Status | Borrower | Loan Amount |
|---|---|---|---|
| Open | Randall Shelly | $199,180 | |
| Previous Owner | Black B Lyle | $205,000 | |
| Previous Owner | Black B Lyle | $25,518 |
Source: Public Records
Tax History Compared to Growth
Tax History
| Year | Tax Paid | Tax Assessment Tax Assessment Total Assessment is a certain percentage of the fair market value that is determined by local assessors to be the total taxable value of land and additions on the property. | Land | Improvement |
|---|---|---|---|---|
| 2025 | $1,824 | $239,745 | $200,300 | $235,600 |
| 2024 | $1,824 | $217,690 | $0 | $0 |
| 2023 | $1,769 | $216,095 | $0 | $0 |
| 2022 | $1,954 | $237,545 | $0 | $0 |
| 2021 | $1,686 | $312,100 | $143,800 | $168,300 |
| 2020 | $1,551 | $281,400 | $128,400 | $153,000 |
| 2019 | $1,347 | $252,800 | $118,000 | $134,800 |
| 2018 | $1,267 | $224,800 | $107,600 | $117,200 |
| 2017 | $1,157 | $109,340 | $0 | $0 |
| 2016 | $1,178 | $107,470 | $0 | $0 |
| 2015 | $1,193 | $103,015 | $0 | $0 |
| 2014 | -- | $101,695 | $0 | $0 |
Source: Public Records
Map
Nearby Homes