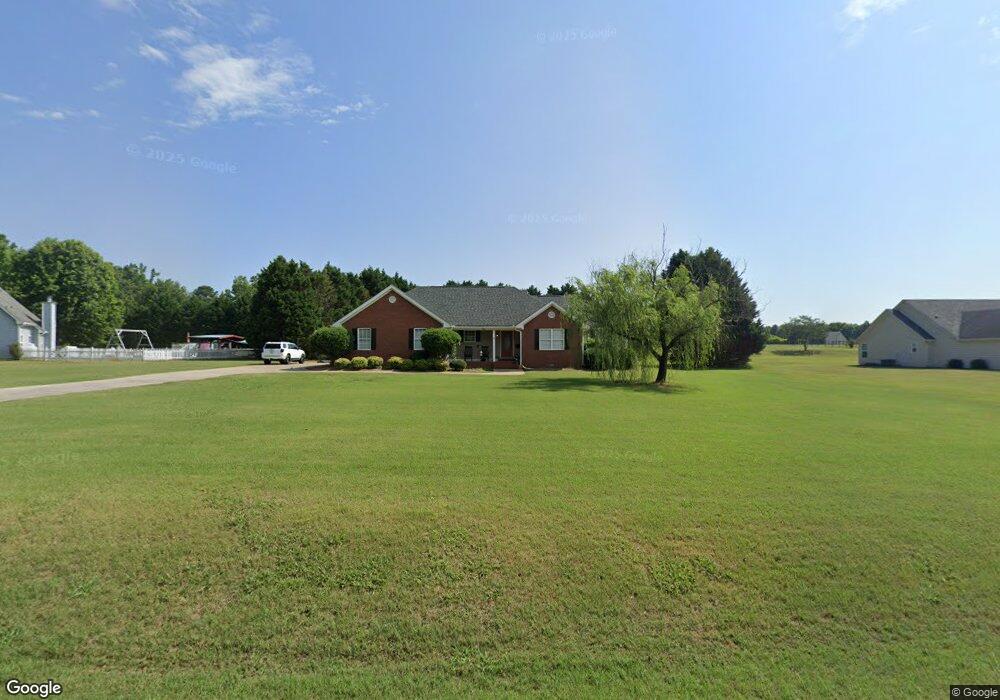
565 Indian Creek Trail Rutledge, GA 30663
Estimated Value: $409,843 - $525,000
4
Beds
2
Baths
2,609
Sq Ft
$176/Sq Ft
Est. Value
About This Home
This home is located at 565 Indian Creek Trail, Rutledge, GA 30663 and is currently estimated at $458,461, approximately $175 per square foot. 565 Indian Creek Trail is a home located in Morgan County with nearby schools including Morgan County Primary School, Morgan County Elementary School, and Morgan County Middle School.
Ownership History
Date
Name
Owned For
Owner Type
Purchase Details
Closed on
Jul 26, 2007
Sold by
United Guaranty Residentia
Bought by
Baig Mirza Qader-Ali
Current Estimated Value
Purchase Details
Closed on
Jun 8, 2007
Sold by
Countrywide Home Loans
Bought by
Federal National Mtg Associati
Purchase Details
Closed on
Mar 22, 2007
Sold by
Federal National Mortgage Association
Bought by
United Guaranty Residential In
Purchase Details
Closed on
Jun 9, 2003
Sold by
Boutwell Jennifer F
Bought by
Boutwell Jennifer F
Purchase Details
Closed on
Jan 24, 2002
Sold by
Schulte Builders Inc
Bought by
Boutwell Frederick E
Purchase Details
Closed on
Mar 28, 2001
Sold by
2Km Partnership
Bought by
Schulte Paul C
Purchase Details
Closed on
Nov 6, 1989
Sold by
Bank Of Morgan County
Bought by
2Km Partnership
Create a Home Valuation Report for This Property
The Home Valuation Report is an in-depth analysis detailing your home's value as well as a comparison with similar homes in the area
Home Values in the Area
Average Home Value in this Area
Purchase History
| Date | Buyer | Sale Price | Title Company |
|---|---|---|---|
| Baig Mirza Qader-Ali | $188,900 | -- | |
| Federal National Mtg Associati | $219,042 | -- | |
| Countrywide Home Loans | $219,042 | -- | |
| United Guaranty Residential In | $188,900 | -- | |
| Boutwell Jennifer F | -- | -- | |
| Boutwell Frederick E | $170,000 | -- | |
| Schulte Builders Inc | -- | -- | |
| Schulte Paul C | $20,000 | -- | |
| 2Km Partnership | -- | -- |
Source: Public Records
Tax History Compared to Growth
Tax History
| Year | Tax Paid | Tax Assessment Tax Assessment Total Assessment is a certain percentage of the fair market value that is determined by local assessors to be the total taxable value of land and additions on the property. | Land | Improvement |
|---|---|---|---|---|
| 2025 | $3,730 | $146,870 | $18,000 | $128,870 |
| 2024 | $3,222 | $124,874 | $12,000 | $112,874 |
| 2023 | $2,775 | $104,324 | $8,000 | $96,324 |
| 2022 | $2,733 | $98,814 | $8,000 | $90,814 |
| 2021 | $2,745 | $98,814 | $8,000 | $90,814 |
| 2020 | $2,772 | $98,814 | $8,000 | $90,814 |
| 2019 | $2,814 | $98,814 | $8,000 | $90,814 |
| 2018 | $2,854 | $98,814 | $8,000 | $90,814 |
| 2017 | $2,881 | $98,321 | $11,200 | $87,121 |
| 2016 | $2,718 | $90,275 | $8,000 | $82,275 |
| 2015 | $2,651 | $86,840 | $8,000 | $78,840 |
| 2014 | $2,798 | $93,880 | $6,000 | $87,880 |
| 2013 | -- | $64,960 | $6,000 | $58,960 |
Source: Public Records
Map
Nearby Homes
- 0 Reese Rd Unit 10622381
- 0 Reese Rd Unit 25651133
- 294 Tuscany Dr
- 0 W Dixie Hwy Unit 10499573
- 1151 Fears Rd
- 0 Fairplay St Unit 10637174
- 224 Hollis St
- 120 Hidden Falls Ct
- 3641 Davis Academy Rd
- 0 Hawkins Academy Rd Unit 10561655
- 1031 Graham Dr
- 5521 Atlanta Hwy
- 00 Fears Rd
- 00 Fears Rd
- 5761 W Dixie Hwy
- 1310 Deerwood Dr
- 0 Fears Rd Unit 10569285
- 5841 Atlanta Hwy
- 2470 Fears Rd
- 1051 Long Wood Dr
- 565 Indian Creek Trail Unit 2
- 506 Indian Creek Trail
- 563 Indian Creek Trail
- LOT 12 Indian Creek Trail
- 504 Indian Creek Trail
- 562 Indian Creek Trail
- 502 Indian Creek Trail
- 508 Indian Creek Trail
- 561 Indian Creek Trail
- 503 Indian Creek Trail
- 0 Fairplay Prospect Rd Unit 8446482
- 111 Hidden Springs Dr
- 0 Fairplay Prospect Rd Unit 8417109
- 0 Fairplay Rd Unit 3 8412693
- 75.78 Ac Davis Acdemy Rd
- 0 Reese Rd Unit TR2 2523052
- 0 Reese Rd Unit 3285640
- 0 Reese Rd Unit TR2 7089926
- 0 Fairplay Rd Unit 7099569
- 0 Reese Rd Unit 7246162