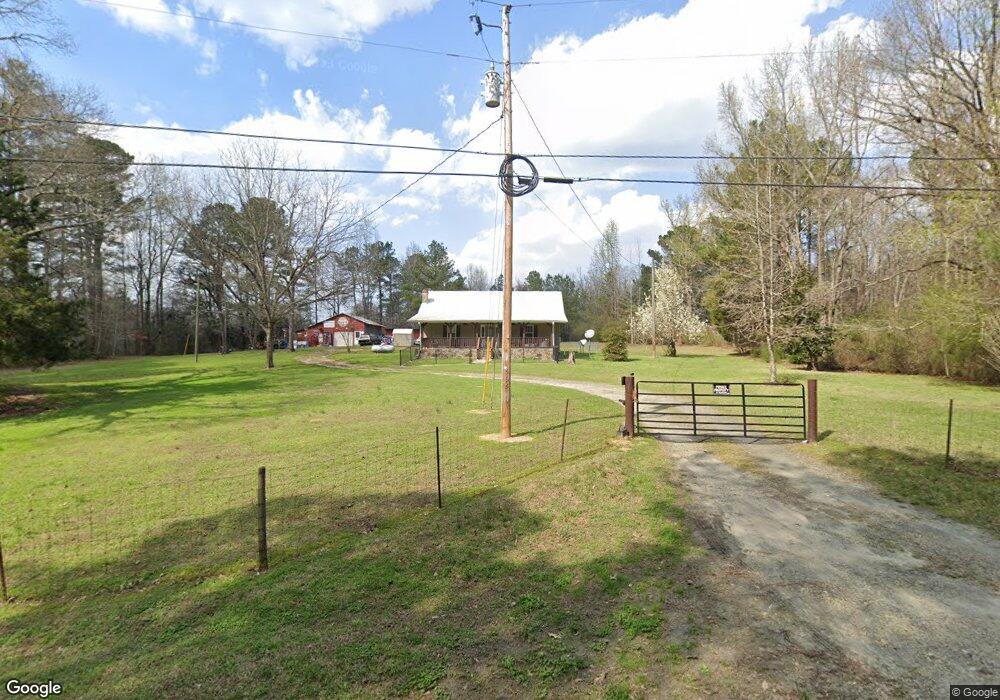
565 Kirk Rd Franklin, GA 30217
Estimated Value: $187,946 - $246,000
2
Beds
1
Bath
1,472
Sq Ft
$139/Sq Ft
Est. Value
About This Home
This home is located at 565 Kirk Rd, Franklin, GA 30217 and is currently estimated at $204,237, approximately $138 per square foot. 565 Kirk Rd is a home located in Heard County with nearby schools including Heard County High School.
Ownership History
Date
Name
Owned For
Owner Type
Purchase Details
Closed on
May 27, 2009
Sold by
Delano Emina
Bought by
Delano Frank Anthony
Current Estimated Value
Purchase Details
Closed on
Oct 27, 2008
Sold by
Delano Frank A
Bought by
Delano Frank A and Delano Emina
Purchase Details
Closed on
Feb 25, 2005
Sold by
Federal National Mortgage Association
Bought by
Delano Frank T and Delano Emina
Purchase Details
Closed on
Sep 7, 2004
Sold by
National City Mortgage Company
Bought by
Federal National Mortgage Company
Purchase Details
Closed on
Jul 1, 1992
Sold by
Foster Richard Lee
Bought by
Puckett Wendell
Purchase Details
Closed on
Oct 1, 1975
Bought by
Foster Richard Lee
Create a Home Valuation Report for This Property
The Home Valuation Report is an in-depth analysis detailing your home's value as well as a comparison with similar homes in the area
Purchase History
| Date | Buyer | Sale Price | Title Company |
|---|---|---|---|
| Delano Frank Anthony | -- | -- | |
| Delano Frank A | -- | -- | |
| Delano Frank T | $55,000 | -- | |
| Federal National Mortgage Company | $85,600 | -- | |
| National City Mortgage Company | $85,300 | -- | |
| Puckett Wendell | $39,000 | -- | |
| Foster Richard Lee | -- | -- |
Source: Public Records
Tax History
| Year | Tax Paid | Tax Assessment Tax Assessment Total Assessment is a certain percentage of the fair market value that is determined by local assessors to be the total taxable value of land and additions on the property. | Land | Improvement |
|---|---|---|---|---|
| 2025 | $847 | $61,719 | $11,242 | $50,477 |
| 2024 | $809 | $57,054 | $6,625 | $50,429 |
| 2023 | $724 | $51,606 | $5,521 | $46,085 |
| 2022 | $659 | $48,483 | $3,537 | $44,946 |
| 2021 | $432 | $36,589 | $3,536 | $33,053 |
| 2020 | $414 | $35,575 | $3,537 | $32,038 |
| 2019 | $414 | $35,575 | $3,537 | $32,038 |
| 2018 | $805 | $35,575 | $3,537 | $32,038 |
| 2017 | $382 | $33,855 | $3,216 | $30,639 |
| 2016 | $483 | $38,336 | $3,216 | $35,120 |
| 2015 | -- | $31,993 | $5,521 | $26,472 |
| 2014 | -- | $32,018 | $5,521 | $26,497 |
| 2013 | -- | $35,573 | $5,520 | $30,052 |
Source: Public Records
Map
Nearby Homes
- 1229 Boggus Rd
- 51+/- AC Noles Rd
- 45+/- AC Noles Rd
- 51+/- Ac Noles Rd
- 0 Tbd Tower Rd
- 340 Noles Rd
- 45+/- Ac Noles Rd
- 0 Bevis Rd Parcel 7 Unit 10559612
- 39 Brush Creek Park Rd
- 0 Lipham Rd Unit 10505011
- 205 Riverview Rd Unit LOT 16B
- 207 Riverview Rd Unit LOT 15B
- 0 Bevis Unit LOT 1
- 0 Victory Rd Unit LOT 1
- 0 Victory Rd Unit LOT 2
- 0 Victory Rd Unit LOT 5
- 0 Victory Rd Unit LOT 3
- 6534 Ga Highway 219
- 0 Liberty Hill Glenn Rd
- 175 Thornton Rd
Your Personal Tour Guide
Ask me questions while you tour the home.