Estimated Value: $200,131 - $221,000
3
Beds
2
Baths
1,860
Sq Ft
$113/Sq Ft
Est. Value
About This Home
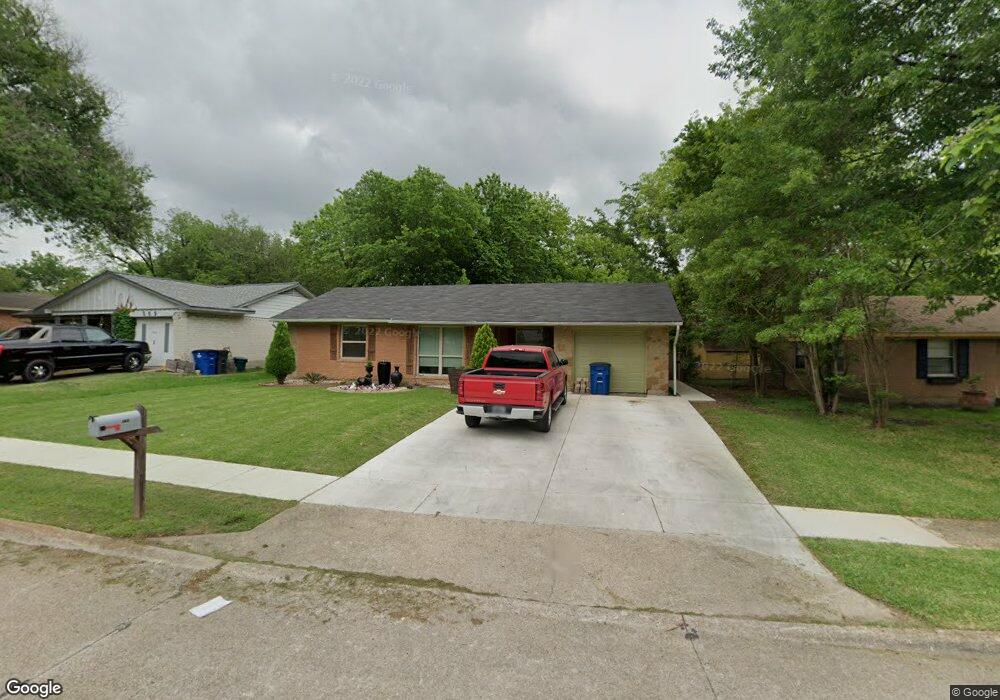
This home is located at 565 Lakeshore Dr, Ennis, TX 75119 and is currently estimated at $210,566, approximately $113 per square foot. 565 Lakeshore Dr is a home located in Ellis County with nearby schools including Austin Elementary School, Dorie Miller Int, and Ennis Junior High School.
Ownership History
Date
Name
Owned For
Owner Type
Purchase Details
Closed on
Sep 26, 2013
Sold by
Little Dennis and French Mike
Bought by
Padilla Angelica and Contreras Camilo
Current Estimated Value
Home Financials for this Owner
Home Financials are based on the most recent Mortgage that was taken out on this home.
Original Mortgage
$69,900
Outstanding Balance
$18,555
Interest Rate
4.62%
Mortgage Type
Purchase Money Mortgage
Estimated Equity
$192,011
Purchase Details
Closed on
Apr 2, 2013
Sold by
Watson Anthony R
Bought by
Little Dennis and French Mike
Purchase Details
Closed on
Mar 11, 2010
Sold by
Odom W W and Odom Cynthia
Bought by
Watson Anthony R
Home Financials for this Owner
Home Financials are based on the most recent Mortgage that was taken out on this home.
Original Mortgage
$11,338
Interest Rate
4.97%
Mortgage Type
Purchase Money Mortgage
Purchase Details
Closed on
Nov 9, 2005
Sold by
Haisler William E and Haisler Nolan E
Bought by
Odom W W
Create a Home Valuation Report for This Property
The Home Valuation Report is an in-depth analysis detailing your home's value as well as a comparison with similar homes in the area
Home Values in the Area
Average Home Value in this Area
Purchase History
| Date | Buyer | Sale Price | Title Company |
|---|---|---|---|
| Padilla Angelica | -- | Providence Title | |
| Little Dennis | $13,001 | None Available | |
| Watson Anthony R | -- | None Available | |
| Watson Anthony R | -- | None Available | |
| Odom W W | -- | None Available |
Source: Public Records
Mortgage History
| Date | Status | Borrower | Loan Amount |
|---|---|---|---|
| Open | Padilla Angelica | $69,900 | |
| Previous Owner | Watson Anthony R | $11,338 |
Source: Public Records
Tax History Compared to Growth
Tax History
| Year | Tax Paid | Tax Assessment Tax Assessment Total Assessment is a certain percentage of the fair market value that is determined by local assessors to be the total taxable value of land and additions on the property. | Land | Improvement |
|---|---|---|---|---|
| 2025 | $3,543 | $268,396 | $55,000 | $213,396 |
| 2024 | $3,543 | $164,569 | $45,000 | $119,569 |
| 2023 | $3,543 | $178,261 | $45,000 | $133,261 |
| 2022 | $3,669 | $153,319 | $36,000 | $117,319 |
| 2021 | $3,063 | $121,670 | $20,000 | $101,670 |
| 2020 | $2,999 | $116,530 | $20,000 | $96,530 |
| 2019 | $2,027 | $77,350 | $0 | $0 |
| 2018 | $1,728 | $65,930 | $20,000 | $45,930 |
| 2017 | $1,615 | $60,900 | $18,000 | $42,900 |
| 2016 | $1,608 | $60,630 | $18,000 | $42,630 |
| 2015 | $1,365 | $58,770 | $18,000 | $40,770 |
| 2014 | $1,365 | $51,520 | $0 | $0 |
Source: Public Records
Map
Nearby Homes
- 507 Lakeshore Dr
- 536 Lakeshore Dr
- 2410 Linda Dr
- 805 Loy Ln
- 2308 Louise Ln
- 1509 Lyndale Dr
- 3712 Kings Dr
- 2800 Boyd St
- 2900 Boyd St
- 1207 Louise Ln
- 206 Houston St
- 707 Oakmont Dr
- 1106 N Mckinney St
- 2810 Belmont Dr
- 1103 Sunset Dr
- 1002 Hoylake Ct
- 801 Woodcrest Dr
- 717 Woodcrest Dr
- 1206 N Kaufman St
- 1311 Daffan Ave
- 569 Lakeshore Dr
- 561 Lakeshore Dr
- 573 Lakeshore Dr
- 557 Lakeshore Dr
- 513 Cherry Ln
- 509 Cherry Ln
- 517 Cherry Ln
- 577 Lakeshore Dr
- 566 Lakeshore Dr
- 553 Lakeshore Dr
- 562 Lakeshore Dr
- 521 Cherry Ln
- 507 Cherry Ln
- 574 Lakeshore Dr
- 581 Lakeshore Dr
- 558 Lakeshore Dr
- 556 Lakeshore Dr
- 578 Lakeshore Dr
- 525 Cherry Ln
- 549 Lakeshore Dr