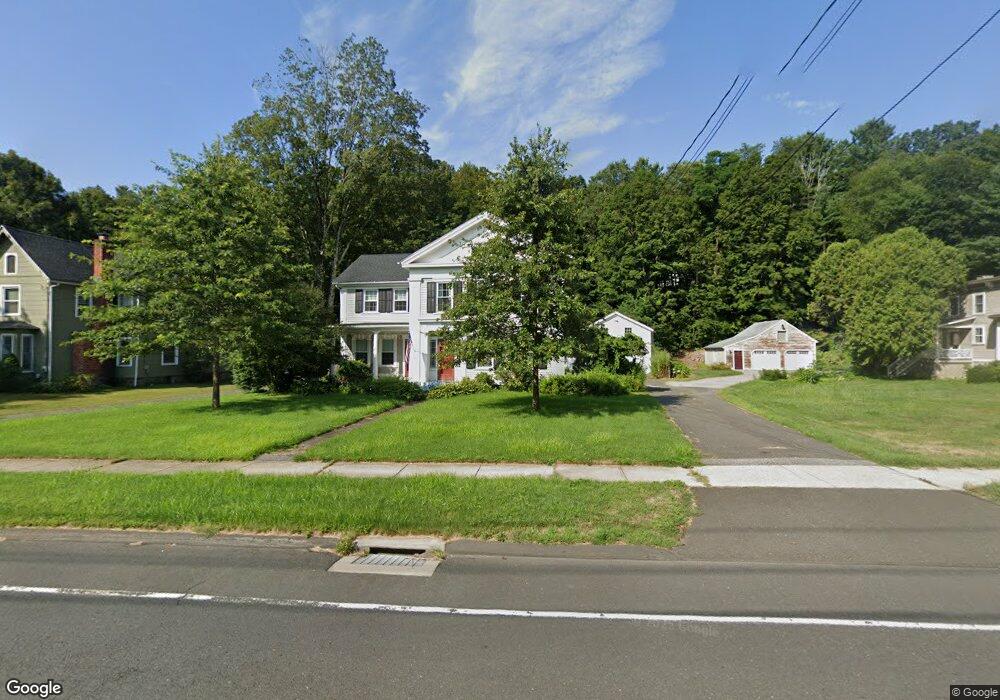
565 Main St New Hartford, CT 06057
Estimated Value: $415,000 - $632,000
3
Beds
2
Baths
2,639
Sq Ft
$193/Sq Ft
Est. Value
About This Home
This home is located at 565 Main St, New Hartford, CT 06057 and is currently estimated at $508,708, approximately $192 per square foot. 565 Main St is a home located in Litchfield County with nearby schools including Ann Antolini School, Northwestern Regional Middle School, and Northwestern Regional High School.
Ownership History
Date
Name
Owned For
Owner Type
Purchase Details
Closed on
Nov 24, 2003
Sold by
Bouchard Rodney A and Bouchard Cynthia J
Bought by
Toro Joseph F and Toro Margaret H
Current Estimated Value
Home Financials for this Owner
Home Financials are based on the most recent Mortgage that was taken out on this home.
Original Mortgage
$280,000
Interest Rate
3.5%
Purchase Details
Closed on
Dec 3, 1993
Sold by
Knowlton Lawrence E and Knowlton Nancy C
Bought by
Miller W Russell W and Miller Ketty D
Create a Home Valuation Report for This Property
The Home Valuation Report is an in-depth analysis detailing your home's value as well as a comparison with similar homes in the area
Home Values in the Area
Average Home Value in this Area
Purchase History
| Date | Buyer | Sale Price | Title Company |
|---|---|---|---|
| Toro Joseph F | $350,000 | -- | |
| Miller W Russell W | $188,000 | -- |
Source: Public Records
Mortgage History
| Date | Status | Borrower | Loan Amount |
|---|---|---|---|
| Open | Miller W Russell W | $266,840 | |
| Closed | Miller W Russell W | $280,000 | |
| Previous Owner | Miller W Russell W | $50,000 |
Source: Public Records
Tax History Compared to Growth
Tax History
| Year | Tax Paid | Tax Assessment Tax Assessment Total Assessment is a certain percentage of the fair market value that is determined by local assessors to be the total taxable value of land and additions on the property. | Land | Improvement |
|---|---|---|---|---|
| 2025 | $7,436 | $261,170 | $44,660 | $216,510 |
| 2024 | $7,140 | $261,170 | $44,660 | $216,510 |
| 2023 | $6,493 | $196,630 | $44,660 | $151,970 |
| 2022 | $6,353 | $196,630 | $44,660 | $151,970 |
| 2021 | $6,416 | $196,630 | $44,660 | $151,970 |
| 2020 | $6,357 | $196,630 | $44,660 | $151,970 |
| 2019 | $6,282 | $196,630 | $44,660 | $151,970 |
| 2018 | $6,106 | $188,930 | $44,660 | $144,270 |
| 2017 | $5,898 | $188,930 | $44,660 | $144,270 |
| 2016 | $5,880 | $188,930 | $44,660 | $144,270 |
| 2015 | $5,581 | $188,930 | $44,660 | $144,270 |
| 2014 | $5,419 | $188,930 | $44,660 | $144,270 |
Source: Public Records
Map
Nearby Homes