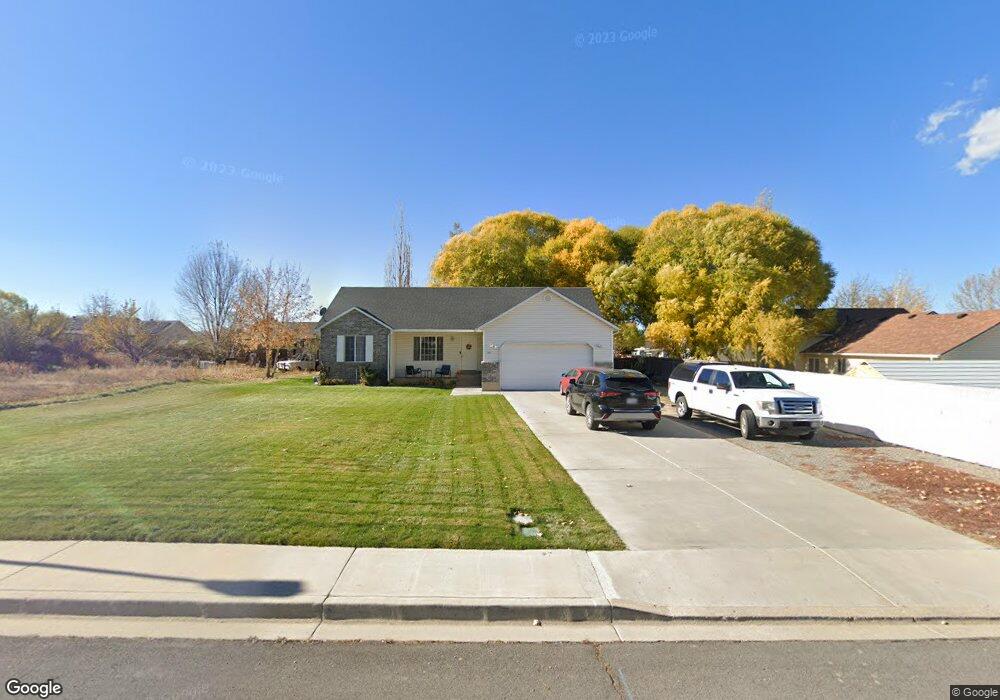
565 N 100 W Santaquin, UT 84655
Estimated Value: $446,000 - $485,000
3
Beds
2
Baths
1,230
Sq Ft
$377/Sq Ft
Est. Value
About This Home
This home is located at 565 N 100 W, Santaquin, UT 84655 and is currently estimated at $463,255, approximately $376 per square foot. 565 N 100 W is a home located in Utah County with nearby schools including Apple Valley Elementary, Payson Junior High School, and Payson High School.
Ownership History
Date
Name
Owned For
Owner Type
Purchase Details
Closed on
Aug 30, 2023
Sold by
Dees Eric and Dees Sarah
Bought by
Eric And Sarah Dees Living Trust and Dees
Current Estimated Value
Purchase Details
Closed on
Feb 1, 2000
Sold by
Anderson Donald and Anderson Guenn A
Bought by
Alpine Summit Homes Llc
Purchase Details
Closed on
Aug 30, 1999
Sold by
Anderson Donald R and Anderson Guenn A
Bought by
Alpine Summit Homes Llc
Home Financials for this Owner
Home Financials are based on the most recent Mortgage that was taken out on this home.
Original Mortgage
$100,800
Interest Rate
7.47%
Mortgage Type
Construction
Purchase Details
Closed on
Mar 15, 1999
Sold by
Anderson Donald and Anderson Gueen
Bought by
Anderson Donald and Anderson Guenn A
Purchase Details
Closed on
Mar 1, 1999
Sold by
Ppm Inc
Bought by
Anderson Donald and Anderson Gueen
Create a Home Valuation Report for This Property
The Home Valuation Report is an in-depth analysis detailing your home's value as well as a comparison with similar homes in the area
Home Values in the Area
Average Home Value in this Area
Purchase History
| Date | Buyer | Sale Price | Title Company |
|---|---|---|---|
| Eric And Sarah Dees Living Trust | -- | None Listed On Document | |
| Alpine Summit Homes Llc | -- | Wasatch Land & Title | |
| Alpine Summit Homes Llc | -- | Wasatch Land & Title | |
| Anderson Donald | -- | Wasatch Land & Title | |
| Anderson Donald | -- | -- |
Source: Public Records
Mortgage History
| Date | Status | Borrower | Loan Amount |
|---|---|---|---|
| Previous Owner | Alpine Summit Homes Llc | $100,800 |
Source: Public Records
Tax History Compared to Growth
Tax History
| Year | Tax Paid | Tax Assessment Tax Assessment Total Assessment is a certain percentage of the fair market value that is determined by local assessors to be the total taxable value of land and additions on the property. | Land | Improvement |
|---|---|---|---|---|
| 2025 | $2,069 | $230,395 | $146,000 | $272,900 |
| 2024 | $2,069 | $206,030 | $0 | $0 |
| 2023 | $2,126 | $212,410 | $0 | $0 |
| 2022 | $2,197 | $226,380 | $0 | $0 |
| 2021 | $1,866 | $298,100 | $82,300 | $215,800 |
| 2020 | $1,790 | $277,100 | $71,600 | $205,500 |
| 2019 | $1,635 | $258,800 | $71,600 | $187,200 |
| 2018 | $1,495 | $225,700 | $62,500 | $163,200 |
| 2017 | $1,418 | $114,345 | $0 | $0 |
| 2016 | $1,327 | $104,830 | $0 | $0 |
| 2015 | $1,209 | $93,720 | $0 | $0 |
| 2014 | $1,120 | $86,625 | $0 | $0 |
Source: Public Records
Map
Nearby Homes