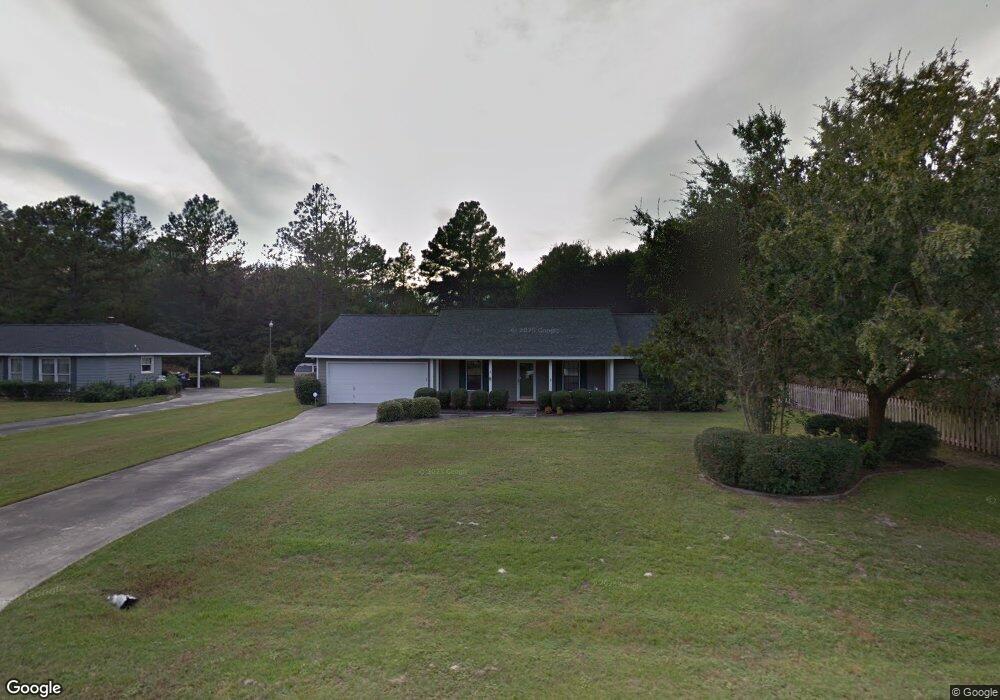
565 S Oaks Ct Waycross, GA 31503
Estimated Value: $176,149 - $230,000
3
Beds
2
Baths
1,296
Sq Ft
$164/Sq Ft
Est. Value
About This Home
This home is located at 565 S Oaks Ct, Waycross, GA 31503 and is currently estimated at $213,037, approximately $164 per square foot. 565 S Oaks Ct is a home located in Ware County with nearby schools including Memorial Drive Elementary School, Waycross Middle School, and Ware County High School.
Ownership History
Date
Name
Owned For
Owner Type
Purchase Details
Closed on
Aug 8, 2017
Sold by
Harkleroad Jason S
Bought by
Hundley David C
Current Estimated Value
Home Financials for this Owner
Home Financials are based on the most recent Mortgage that was taken out on this home.
Original Mortgage
$119,700
Outstanding Balance
$100,068
Interest Rate
4.03%
Mortgage Type
New Conventional
Estimated Equity
$112,969
Purchase Details
Closed on
Sep 29, 2008
Sold by
Hudson Julianna W
Bought by
Harkleroad Jason
Home Financials for this Owner
Home Financials are based on the most recent Mortgage that was taken out on this home.
Original Mortgage
$108,300
Interest Rate
6.36%
Mortgage Type
New Conventional
Purchase Details
Closed on
May 21, 2003
Sold by
Williams Mark H and Williams Su
Bought by
Hudson Dustin S
Purchase Details
Closed on
Aug 3, 1992
Bought by
Williams Mark H and Williams Su
Purchase Details
Closed on
Feb 13, 1992
Bought by
Bryson Anthony Allen
Purchase Details
Closed on
Jan 6, 1989
Bought by
Johnson Eugene
Create a Home Valuation Report for This Property
The Home Valuation Report is an in-depth analysis detailing your home's value as well as a comparison with similar homes in the area
Home Values in the Area
Average Home Value in this Area
Purchase History
| Date | Buyer | Sale Price | Title Company |
|---|---|---|---|
| Hundley David C | $126,000 | -- | |
| Harkleroad Jason | $114,000 | -- | |
| Hudson Dustin S | $85,000 | -- | |
| Williams Mark H | $55,600 | -- | |
| Bryson Anthony Allen | $5,300 | -- | |
| Johnson Eugene | -- | -- |
Source: Public Records
Mortgage History
| Date | Status | Borrower | Loan Amount |
|---|---|---|---|
| Open | Hundley David C | $119,700 | |
| Previous Owner | Harkleroad Jason | $108,300 |
Source: Public Records
Tax History Compared to Growth
Tax History
| Year | Tax Paid | Tax Assessment Tax Assessment Total Assessment is a certain percentage of the fair market value that is determined by local assessors to be the total taxable value of land and additions on the property. | Land | Improvement |
|---|---|---|---|---|
| 2024 | $1,455 | $60,630 | $5,100 | $55,530 |
| 2023 | $1,484 | $62,608 | $12,000 | $50,608 |
| 2022 | $1,668 | $62,608 | $12,000 | $50,608 |
| 2021 | $1,825 | $58,176 | $12,000 | $46,176 |
| 2020 | $1,441 | $45,432 | $12,000 | $33,432 |
| 2019 | $1,377 | $42,600 | $12,000 | $30,600 |
| 2018 | $1,344 | $41,184 | $12,000 | $29,184 |
| 2017 | $1,343 | $41,184 | $12,000 | $29,184 |
| 2016 | $1,343 | $41,184 | $12,000 | $29,184 |
| 2015 | $1,355 | $41,184 | $12,000 | $29,184 |
| 2014 | $1,353 | $41,184 | $12,000 | $29,184 |
| 2013 | -- | $41,184 | $12,000 | $29,184 |
Source: Public Records
Map
Nearby Homes
- 3817 Central Ave
- 606 Stonewall Jackson Place
- 664 Saddle Cir
- 630 Saddle Cir
- 627 Saddle Cir
- 851 Carriage Ln
- 1132 Hilltop Rd
- 1072 Lawhorne Dr
- 3153 Southwood Dr
- 4155 Pinecrest Rd
- 3070 Central Ave
- Tract 4 County-Line Rd S
- 763 Kentland Dr
- 867 Kentland Dr
- 4337 White Hall Church Rd
- 4337 Whitehall Church Rd
- 2775 Seminole Trail
- 723 St Bernard Trail
- 1049 Riverdale Dr
- 291 Sawdust Trail