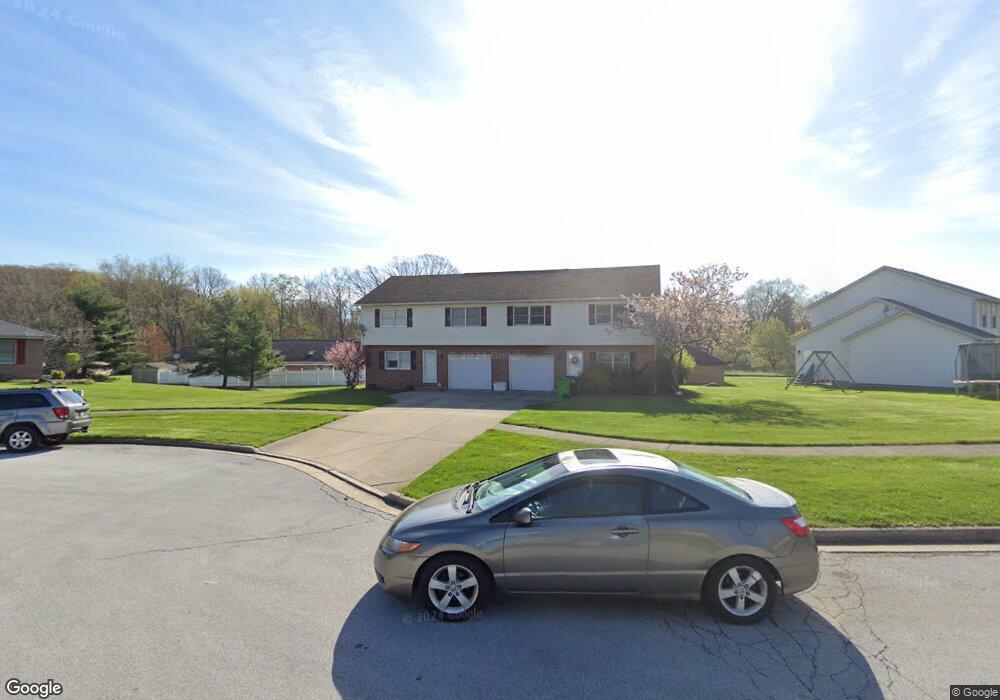
565 Stone Creek Dr Unit 567 Tallmadge, OH 44278
Estimated Value: $325,682 - $338,000
3
Beds
4
Baths
2,928
Sq Ft
$113/Sq Ft
Est. Value
About This Home
This home is located at 565 Stone Creek Dr Unit 567, Tallmadge, OH 44278 and is currently estimated at $329,921, approximately $112 per square foot. 565 Stone Creek Dr Unit 567 is a home located in Summit County with nearby schools including Tallmadge Middle School, Tallmadge High School, and Cornerstone Community School.
Ownership History
Date
Name
Owned For
Owner Type
Purchase Details
Closed on
Aug 8, 2025
Sold by
Cynthia J Haston Trust and Haston Cynthia J
Bought by
Boncutiu Vasile
Current Estimated Value
Purchase Details
Closed on
Mar 28, 2014
Sold by
Haston Cynthia J
Bought by
Haston Cynthia J and The Cynthia J Haston Trust
Purchase Details
Closed on
Jan 31, 2006
Sold by
M & R Rentals
Bought by
Haston Cynthia J
Home Financials for this Owner
Home Financials are based on the most recent Mortgage that was taken out on this home.
Original Mortgage
$129,430
Interest Rate
6.75%
Mortgage Type
Fannie Mae Freddie Mac
Purchase Details
Closed on
Aug 2, 1994
Sold by
Howard W Atwood Trst
Bought by
Merrow/Mosholder Const Co Inc
Create a Home Valuation Report for This Property
The Home Valuation Report is an in-depth analysis detailing your home's value as well as a comparison with similar homes in the area
Home Values in the Area
Average Home Value in this Area
Purchase History
| Date | Buyer | Sale Price | Title Company |
|---|---|---|---|
| Boncutiu Vasile | $325,000 | Chicago Title | |
| Haston Cynthia J | -- | Chicago Title Insurance Co | |
| Haston Cynthia J | $184,900 | Cardinal First Title Inc | |
| Merrow/Mosholder Const Co Inc | $35,000 | -- |
Source: Public Records
Mortgage History
| Date | Status | Borrower | Loan Amount |
|---|---|---|---|
| Previous Owner | Haston Cynthia J | $129,430 |
Source: Public Records
Tax History Compared to Growth
Tax History
| Year | Tax Paid | Tax Assessment Tax Assessment Total Assessment is a certain percentage of the fair market value that is determined by local assessors to be the total taxable value of land and additions on the property. | Land | Improvement |
|---|---|---|---|---|
| 2025 | $4,582 | $89,831 | $17,948 | $71,883 |
| 2024 | $4,582 | $89,831 | $17,948 | $71,883 |
| 2023 | $4,582 | $89,831 | $17,948 | $71,883 |
| 2022 | $5,672 | $81,725 | $16,317 | $65,408 |
| 2021 | $5,265 | $81,725 | $16,317 | $65,408 |
| 2020 | $5,083 | $81,730 | $16,320 | $65,410 |
| 2019 | $4,709 | $67,690 | $14,880 | $52,810 |
| 2018 | $4,161 | $67,690 | $14,880 | $52,810 |
| 2017 | $4,205 | $67,690 | $14,880 | $52,810 |
| 2016 | $4,528 | $67,690 | $14,880 | $52,810 |
| 2015 | $4,205 | $67,690 | $14,880 | $52,810 |
| 2014 | $4,108 | $67,690 | $14,880 | $52,810 |
| 2013 | $3,054 | $51,300 | $14,880 | $36,420 |
Source: Public Records
Map
Nearby Homes
- 2330 Eastwood Ave
- 689 Alaho St
- 2354 Savoy Ave
- 49 Douglas Ct
- 130 Strecker Dr
- 685 Beechview Dr
- 505 Moody St
- 353 Southeast Ave
- 331 Southeast Ave
- 313 Southeast Ave
- 459 Alaho St
- 2253 Tyro Ave
- 469 Lodi St
- 464 Carruthers Rd
- 77 Northwood Ln
- 213 Green Hill Dr
- 549 S Munroe Rd
- 523 S Munroe Rd
- 75 Glenwood Cir
- 84 Southeast Ave
- 583 Stone Creek Dr
- 570 Pheasant Run Unit 572
- 555 Stone Creek Dr Unit 557
- 581 Stone Creek Dr Unit 583
- 554 Pheasant Run Unit 556
- 574 Stone Creek Dr Unit 576
- 560 Stone Creek Dr Unit 562
- 540 Pheasant Run Unit 542
- 584 Stone Creek Dr Unit 586
- 590 Stone Creek Dr Unit 592
- 530 Pheasant Run Unit 532
- 512 Pheasant Run
- 510 Pheasant Run Unit 512
- 510-512 Pheasant Run Rd
- 562 Colony Park Dr Unit 306
- 562 Colony Park Dr Unit 208
- 562 Colony Park Dr Unit 207
- 2351 Eastwood Ave
- 2345 Eastwood Ave
- 2361 Eastwood Ave