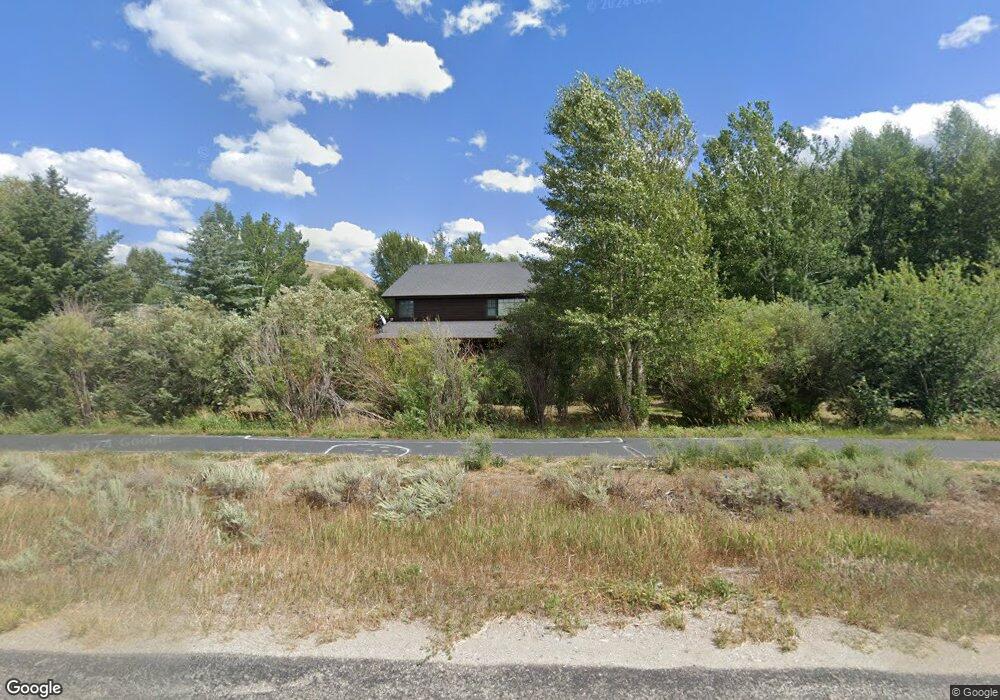
565 Trails End Jackson, WY 83001
Estimated Value: $2,921,000 - $4,119,000
4
Beds
3
Baths
2,800
Sq Ft
$1,266/Sq Ft
Est. Value
About This Home
This home is located at 565 Trails End, Jackson, WY 83001 and is currently estimated at $3,544,345, approximately $1,265 per square foot. 565 Trails End is a home located in Teton County with nearby schools including Colter Elementary School, Jackson Hole Middle School, and Jackson Hole High School.
Ownership History
Date
Name
Owned For
Owner Type
Purchase Details
Closed on
Dec 27, 2022
Sold by
Halpin Brett R
Bought by
Mountain Home Investments Llc
Current Estimated Value
Purchase Details
Closed on
Aug 17, 2020
Sold by
Halpin Peter T and Halpin Diane R
Bought by
Halpin Kelly C
Purchase Details
Closed on
Aug 14, 2020
Sold by
Halpin Kelly C
Bought by
Halpin Peter T and Halpin Diane R
Purchase Details
Closed on
Aug 10, 2020
Sold by
Halpin Diane R
Bought by
Halpin Peter T and Halpin Diane R
Purchase Details
Closed on
Aug 6, 2020
Sold by
Halpin Peter T
Bought by
Halpin Peter T and Halpin Diane R
Purchase Details
Closed on
Sep 18, 2012
Sold by
Halpin Peter T
Bought by
Halpin Peter T and Mendoza Brett Halpin
Purchase Details
Closed on
Sep 6, 2012
Sold by
Johnson Benjamin P and Johnson Sarajane
Bought by
Halpin Peter T
Purchase Details
Closed on
Aug 31, 2005
Sold by
Spray Charles and Lombardi Spray Mary Lisa
Bought by
Halpin Peter T and Halpin Diane R
Create a Home Valuation Report for This Property
The Home Valuation Report is an in-depth analysis detailing your home's value as well as a comparison with similar homes in the area
Purchase History
| Date | Buyer | Sale Price | Title Company |
|---|---|---|---|
| Mountain Home Investments Llc | -- | -- | |
| Mountain Home Investments Llc | -- | -- | |
| Halpin Kelly C | -- | None Available | |
| Halpin Peter T | -- | None Available | |
| Halpin Peter T | -- | None Available | |
| Halpin Brett R | -- | None Available | |
| Halpin Peter T | -- | None Available | |
| Halpin Peter T | -- | None Available | |
| Halpin Peter T | -- | First American Title Insuran | |
| Halpin Peter T | -- | Jackson Hole Title & Escrow |
Source: Public Records
Tax History
| Year | Tax Paid | Tax Assessment Tax Assessment Total Assessment is a certain percentage of the fair market value that is determined by local assessors to be the total taxable value of land and additions on the property. | Land | Improvement |
|---|---|---|---|---|
| 2025 | $16,267 | $277,824 | $108,908 | $168,916 |
| 2024 | $16,267 | $289,976 | $113,672 | $176,304 |
| 2023 | $15,812 | $281,211 | $111,688 | $169,523 |
| 2022 | $13,630 | $243,483 | $111,688 | $131,795 |
| 2021 | $9,168 | $160,895 | $51,300 | $109,595 |
| 2020 | $7,755 | $138,541 | $49,875 | $88,666 |
| 2019 | $7,505 | $131,550 | $51,647 | $79,903 |
| 2018 | $7,363 | $129,741 | $52,435 | $77,306 |
| 2017 | $6,579 | $113,529 | $49,833 | $63,696 |
| 2016 | $6,027 | $104,004 | $52,071 | $51,933 |
| 2015 | $3,921 | $86,128 | $27,463 | $58,665 |
| 2014 | $3,921 | $67,773 | $37,620 | $30,153 |
| 2013 | $3,921 | $67,773 | $37,620 | $30,153 |
Source: Public Records
Map
Nearby Homes
- 855 2244
- 870 Whitehouse Dr
- 1255 Allen Way
- 1874 Josephine Loop
- 2057 Corner Creek Ln Unit 2
- 2055 Corner Creek Ln Unit 312
- 3017 Rangeview Dr
- 2176 Corner Creek Ln Unit C
- 1090 Bluffs Dr
- 802 Powderhorn Ln Unit D
- 804 Powderhorn Ln Unit C
- 750 Powderhorn Ln Unit K-4
- 3016 Alpine View Ln
- 400 Powderhorn Ln Unit 67
- 935 Smith Ln Unit C
- 1023 Budge Dr
- 1400&1450 S Hwy 89
- 400 Red Tail Butte Rd
- 7675 U S Highway 89
- LOT 2 Log Cabin Club Road Rd
Your Personal Tour Guide
Ask me questions while you tour the home.