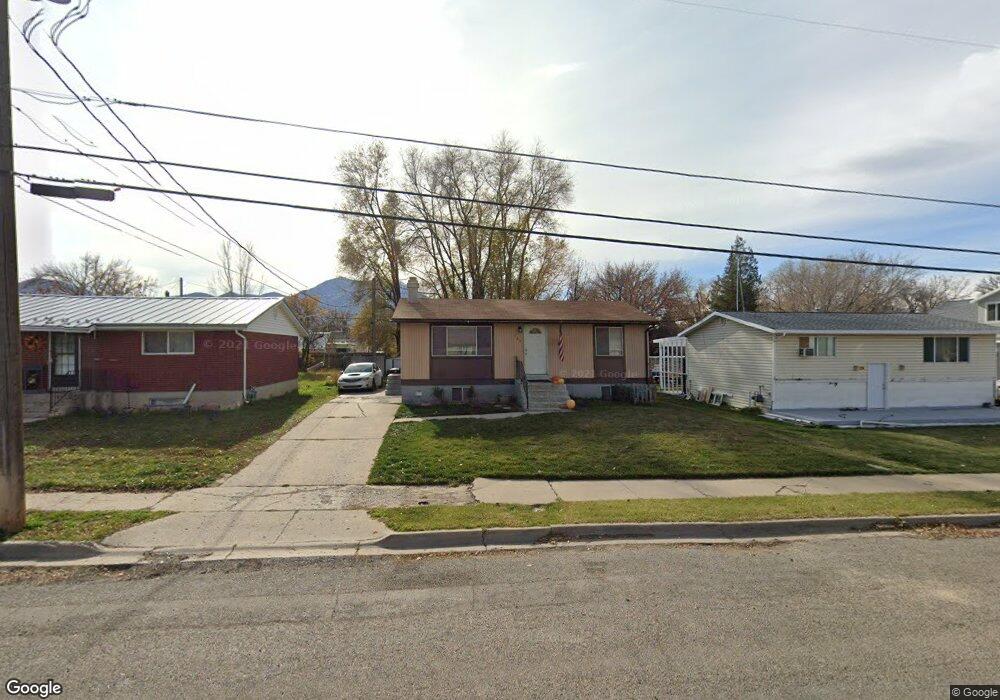
565 W 100 N Payson, UT 84651
Estimated Value: $368,000 - $420,000
4
Beds
1
Bath
1,632
Sq Ft
$240/Sq Ft
Est. Value
About This Home
This home is located at 565 W 100 N, Payson, UT 84651 and is currently estimated at $391,970, approximately $240 per square foot. 565 W 100 N is a home located in Utah County with nearby schools including Taylor Elementary School, Salem Junior High School, and Valley View Middle School.
Ownership History
Date
Name
Owned For
Owner Type
Purchase Details
Closed on
Feb 22, 2013
Sold by
Schumann Tracey
Bought by
Woolsey Joan
Current Estimated Value
Purchase Details
Closed on
Feb 3, 2009
Sold by
Lloyd Brett M and Lloyd Kelly R
Bought by
Lloyd Kelly
Home Financials for this Owner
Home Financials are based on the most recent Mortgage that was taken out on this home.
Original Mortgage
$130,500
Interest Rate
5.14%
Mortgage Type
New Conventional
Create a Home Valuation Report for This Property
The Home Valuation Report is an in-depth analysis detailing your home's value as well as a comparison with similar homes in the area
Home Values in the Area
Average Home Value in this Area
Purchase History
| Date | Buyer | Sale Price | Title Company |
|---|---|---|---|
| Woolsey Joan | -- | Fidelity Land & Title | |
| Lloyd Kelly | -- | Affiliated First Title Comp |
Source: Public Records
Mortgage History
| Date | Status | Borrower | Loan Amount |
|---|---|---|---|
| Previous Owner | Lloyd Kelly | $130,500 |
Source: Public Records
Tax History
| Year | Tax Paid | Tax Assessment Tax Assessment Total Assessment is a certain percentage of the fair market value that is determined by local assessors to be the total taxable value of land and additions on the property. | Land | Improvement |
|---|---|---|---|---|
| 2025 | $1,739 | $183,590 | -- | -- |
| 2024 | $1,739 | $176,990 | $0 | $0 |
| 2023 | $1,773 | $180,895 | $0 | $0 |
| 2022 | $1,786 | $179,300 | $0 | $0 |
| 2021 | $1,520 | $244,700 | $78,900 | $165,800 |
| 2020 | $1,412 | $222,400 | $68,600 | $153,800 |
| 2019 | $1,210 | $195,400 | $61,700 | $133,700 |
| 2018 | $1,082 | $168,400 | $52,100 | $116,300 |
| 2017 | $989 | $82,775 | $0 | $0 |
| 2016 | $933 | $77,550 | $0 | $0 |
| 2015 | $832 | $68,695 | $0 | $0 |
| 2014 | $731 | $60,830 | $0 | $0 |
Source: Public Records
Map
Nearby Homes
- 588 W Utah Ave
- 116 S 300 W
- 128 S 300 W
- 845 W 400 N
- 221 S Majestic Meadows Dr
- 227 S Majestic Meadows Dr
- 742 W 400 S
- 195 W 300 N
- 451 N 500 W
- 451 N 500 W Unit 39
- 533 S 700 W
- 420 N 150 W
- 118 E 100 N
- 116 E 100 S
- 383 W 625 N Unit A-D
- 384 W 650 N Unit A-D
- 626 S 800 W Unit 32
- 361 W 625 N Unit A-D
- 1836 S 100 E
- 390 N 200 E
Your Personal Tour Guide
Ask me questions while you tour the home.