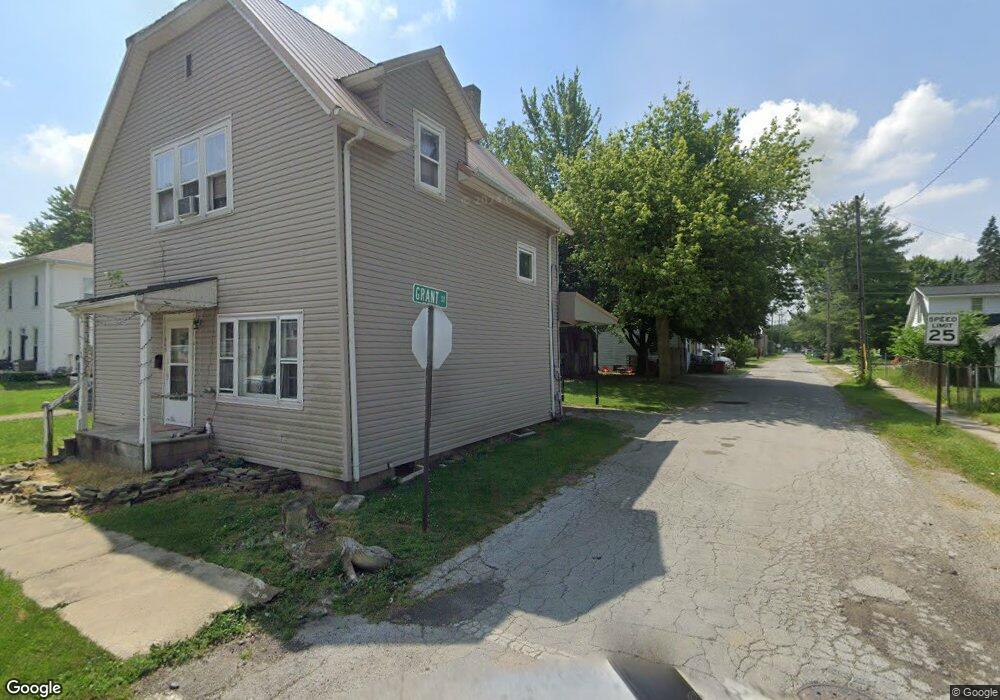
565 W Fremont St Fostoria, OH 44830
Estimated Value: $98,274 - $132,000
3
Beds
1
Bath
1,274
Sq Ft
$90/Sq Ft
Est. Value
About This Home
This home is located at 565 W Fremont St, Fostoria, OH 44830 and is currently estimated at $114,569, approximately $89 per square foot. 565 W Fremont St is a home located in Hancock County with nearby schools including Fostoria Intermediate Elementary School and Fostoria Junior/Senior High School.
Ownership History
Date
Name
Owned For
Owner Type
Purchase Details
Closed on
May 24, 2022
Sold by
Waters Janice A
Bought by
Dyer Pagee
Current Estimated Value
Purchase Details
Closed on
Oct 8, 1996
Sold by
Droll Gerald
Bought by
Waters Janice
Home Financials for this Owner
Home Financials are based on the most recent Mortgage that was taken out on this home.
Original Mortgage
$35,055
Interest Rate
7.5%
Mortgage Type
New Conventional
Create a Home Valuation Report for This Property
The Home Valuation Report is an in-depth analysis detailing your home's value as well as a comparison with similar homes in the area
Home Values in the Area
Average Home Value in this Area
Purchase History
| Date | Buyer | Sale Price | Title Company |
|---|---|---|---|
| Dyer Pagee | -- | Dauterman Kurt A | |
| Waters Janice A | -- | None Listed On Document | |
| Waters Janice | $36,900 | -- |
Source: Public Records
Mortgage History
| Date | Status | Borrower | Loan Amount |
|---|---|---|---|
| Previous Owner | Waters Janice | $35,055 |
Source: Public Records
Tax History Compared to Growth
Tax History
| Year | Tax Paid | Tax Assessment Tax Assessment Total Assessment is a certain percentage of the fair market value that is determined by local assessors to be the total taxable value of land and additions on the property. | Land | Improvement |
|---|---|---|---|---|
| 2024 | $1,043 | $20,940 | $1,850 | $19,090 |
| 2023 | $1,040 | $20,940 | $1,850 | $19,090 |
| 2022 | $1,133 | $20,940 | $1,850 | $19,090 |
| 2021 | $936 | $16,290 | $1,940 | $14,350 |
| 2020 | $941 | $16,290 | $1,940 | $14,350 |
| 2019 | $936 | $16,290 | $1,940 | $14,350 |
| 2018 | $838 | $14,220 | $1,690 | $12,530 |
| 2017 | $465 | $14,220 | $1,690 | $12,530 |
| 2016 | $812 | $14,220 | $1,690 | $12,530 |
| 2015 | $611 | $10,280 | $2,140 | $8,140 |
| 2014 | $614 | $10,360 | $2,140 | $8,220 |
| 2012 | $618 | $12,160 | $2,140 | $10,020 |
Source: Public Records
Map
Nearby Homes
- 509 College Ave
- 603 N Vine St
- 203 N Union St
- 520 N Union St
- 348 W South St
- 351 W South St
- 723 N Union St
- 211 Summit St
- 0 W South Route 12
- 931 N Union St
- 892 N Countyline St
- 435 Park Ave
- 900 N Countyline St
- 901 Central Ave
- 633 Maple St
- 540 N Poplar St
- 321 Mcdougal St
- 411 Monticello Dr
- 418 W Ridge Dr
- 207 W Culbertson St
- 555 W Fremont St
- 326 N Grant St
- 603 W Fremont St
- 551 W Fremont St
- 324 N Grant St
- 325 N Grant St
- 609 W Fremont St
- 549 W Fremont St
- 320 N Grant St
- 615 W Fremont St
- 623 W Fremont St
- 523 W Fremont St
- 558 W Fremont St
- 558 W Fremont St
- 600 W Fremont St
- 617 W Fremont St
- 523 1/2 W Fremont St
- 606 W Fremont St
- 544 W Fremont St
- 521 W Fremont St