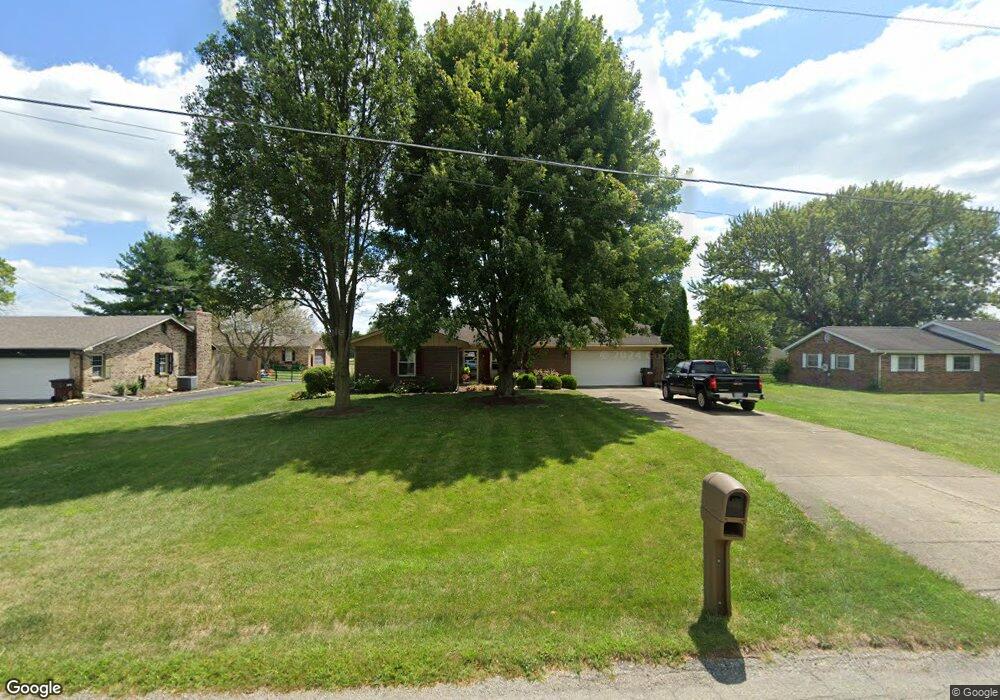
5650 O Neall Rd Waynesville, OH 45068
Wayne Township NeighborhoodEstimated Value: $293,000 - $327,000
3
Beds
2
Baths
1,730
Sq Ft
$176/Sq Ft
Est. Value
About This Home
This home is located at 5650 O Neall Rd, Waynesville, OH 45068 and is currently estimated at $304,712, approximately $176 per square foot. 5650 O Neall Rd is a home located in Warren County with nearby schools including Waynesville Elementary School, Waynesville Middle School, and Waynesville High School.
Ownership History
Date
Name
Owned For
Owner Type
Purchase Details
Closed on
Dec 11, 1997
Sold by
Smith Richard W
Bought by
Bayless Barbara A
Current Estimated Value
Home Financials for this Owner
Home Financials are based on the most recent Mortgage that was taken out on this home.
Original Mortgage
$58,000
Outstanding Balance
$9,890
Interest Rate
7.32%
Mortgage Type
New Conventional
Estimated Equity
$294,822
Purchase Details
Closed on
Aug 28, 1997
Sold by
Jones Michael B
Bought by
Jones Robert S and Jones Betty L
Home Financials for this Owner
Home Financials are based on the most recent Mortgage that was taken out on this home.
Original Mortgage
$86,000
Interest Rate
7.57%
Mortgage Type
New Conventional
Purchase Details
Closed on
Nov 23, 1988
Sold by
Frasure Keith A and Frasure Julia
Bought by
Jones and Jones Michael B
Purchase Details
Closed on
Dec 15, 1978
Sold by
Fields Fields and Fields Lillian Marie
Purchase Details
Closed on
May 18, 1978
Sold by
Stewart Stewart and Stewart Cecil
Create a Home Valuation Report for This Property
The Home Valuation Report is an in-depth analysis detailing your home's value as well as a comparison with similar homes in the area
Home Values in the Area
Average Home Value in this Area
Purchase History
| Date | Buyer | Sale Price | Title Company |
|---|---|---|---|
| Bayless Barbara A | $128,000 | -- | |
| Jones Robert S | $107,500 | -- | |
| Jones | $67,500 | -- | |
| -- | $53,500 | -- | |
| -- | $48,000 | -- |
Source: Public Records
Mortgage History
| Date | Status | Borrower | Loan Amount |
|---|---|---|---|
| Open | Bayless Barbara A | $58,000 | |
| Previous Owner | Jones Robert S | $86,000 |
Source: Public Records
Tax History Compared to Growth
Tax History
| Year | Tax Paid | Tax Assessment Tax Assessment Total Assessment is a certain percentage of the fair market value that is determined by local assessors to be the total taxable value of land and additions on the property. | Land | Improvement |
|---|---|---|---|---|
| 2024 | $2,960 | $74,220 | $19,640 | $54,580 |
| 2023 | $2,612 | $57,498 | $10,503 | $46,994 |
| 2022 | $2,554 | $57,498 | $10,504 | $46,995 |
| 2021 | $2,450 | $57,498 | $10,504 | $46,995 |
| 2020 | $2,310 | $46,746 | $8,540 | $38,206 |
| 2019 | $2,311 | $46,746 | $8,540 | $38,206 |
| 2018 | $2,312 | $46,746 | $8,540 | $38,206 |
| 2017 | $2,181 | $41,139 | $7,641 | $33,499 |
| 2016 | $2,035 | $41,139 | $7,641 | $33,499 |
| 2015 | $2,038 | $41,139 | $7,641 | $33,499 |
| 2014 | $2,007 | $38,450 | $7,140 | $31,310 |
| 2013 | $2,003 | $45,990 | $8,540 | $37,450 |
Source: Public Records
Map
Nearby Homes
- 5669 O Neall Rd
- Tract 3 O'Neall Rd
- Tract 2 O'Neall Rd
- 6363 Trillium Dr
- 0 Trillium Dr Unit 943456
- 4 Corwin Rd
- 0 Ohio 73 Unit 944080
- 127 New Burlington Rd
- 401 Wilkerson Ln
- 155 S Main St
- 196 S 3rd St
- 4752 E Lower Springboro Rd
- 53 S 4th St
- 460 Miami St
- 437 N Main St
- 6748 Rivers Edge Ct
- 350 Somerset Ln
- 0 E Lytle Five Points Rd Unit 902447
- 363 Victoria Place
- 7219 N Us Rt 42
- 5664 O Neall Rd
- 5624 O Neall Rd
- 5670 Oneall Rd
- 5670 O Neall Rd
- 5600 O Neall Rd
- 5694 O Neall Rd
- 5530 O Neall Rd
- 5560 O Neall Rd
- 5720 O Neall Rd
- 5595 O Neall Rd
- 5508 O Neall Rd
- 5741 O Neall Rd
- 5556 O Neall Rd
- 5494 O Neall Rd
- 5454 O Neall Rd
- 5760 O Neall Rd
- 5434 O Neall Rd
- 5705 O Neall Rd
- 5615 O Neall Rd
- 5745 O Neall Rd