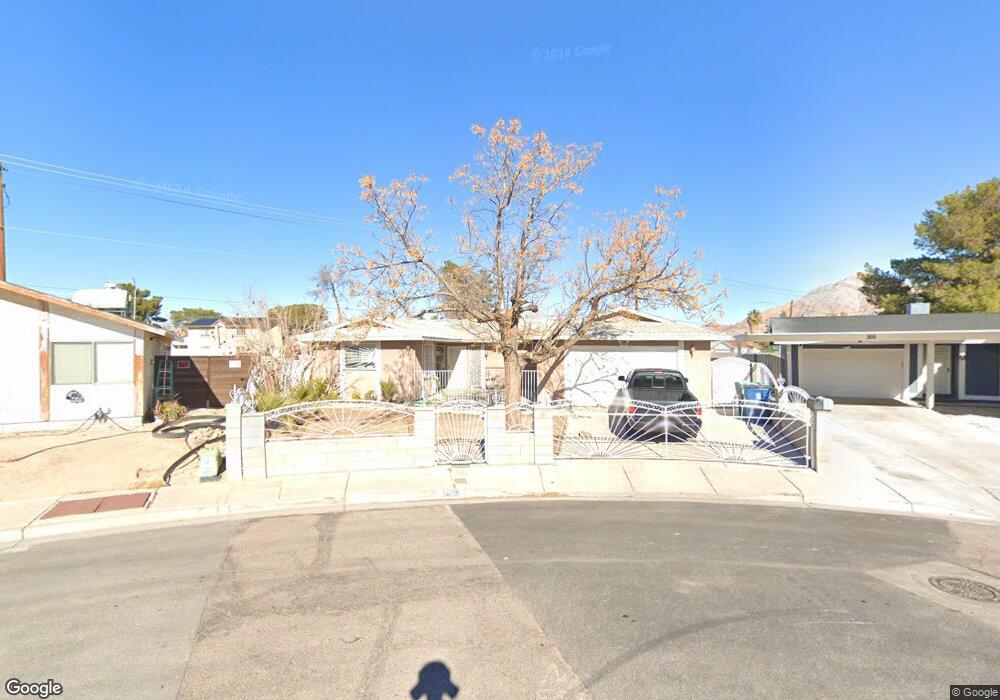
5650 Reuben St Las Vegas, NV 89110
Estimated Value: $296,000 - $364,000
3
Beds
2
Baths
1,196
Sq Ft
$282/Sq Ft
Est. Value
About This Home
This home is located at 5650 Reuben St, Las Vegas, NV 89110 and is currently estimated at $337,386, approximately $282 per square foot. 5650 Reuben St is a home located in Clark County with nearby schools including Richard J. Rundle Elementary School, Charlotte & Jerry Keller Elementary School, and Duane D. Keller Middle School.
Ownership History
Date
Name
Owned For
Owner Type
Purchase Details
Closed on
Oct 31, 2013
Sold by
Vegas Valley Auctions Llc
Bought by
Leon Regina
Current Estimated Value
Purchase Details
Closed on
Oct 23, 2013
Sold by
Leon Regina
Bought by
Another New Idea Llc
Purchase Details
Closed on
Oct 5, 2012
Sold by
Ginger Llc
Bought by
Vegas Vally Auctions Llc
Purchase Details
Closed on
Sep 1, 2011
Sold by
Vegas Valley Auctions Llc
Bought by
Ginger Llc
Purchase Details
Closed on
Jul 5, 2011
Sold by
Rodriguez Victor L
Bought by
Vegas Valley Auctions Llc
Purchase Details
Closed on
Jul 15, 2005
Sold by
Chavez Joel and Chavez Olivia
Bought by
Rodriguez Victor L
Home Financials for this Owner
Home Financials are based on the most recent Mortgage that was taken out on this home.
Original Mortgage
$178,400
Interest Rate
6.05%
Mortgage Type
Unknown
Create a Home Valuation Report for This Property
The Home Valuation Report is an in-depth analysis detailing your home's value as well as a comparison with similar homes in the area
Home Values in the Area
Average Home Value in this Area
Purchase History
| Date | Buyer | Sale Price | Title Company |
|---|---|---|---|
| Leon Regina | -- | Fidelity National Title L | |
| Another New Idea Llc | -- | Fidelity National Title | |
| Vegas Vally Auctions Llc | -- | Lawyers Title Of Nevada Vil | |
| Ginger Llc | -- | Lawyers Title Of Nevada Vil | |
| Vegas Valley Auctions Llc | $50,100 | Fidelity Natl Title Ins Co | |
| Rodriguez Victor L | $223,000 | Fidelity National Title |
Source: Public Records
Mortgage History
| Date | Status | Borrower | Loan Amount |
|---|---|---|---|
| Previous Owner | Rodriguez Victor L | $178,400 |
Source: Public Records
Tax History Compared to Growth
Tax History
| Year | Tax Paid | Tax Assessment Tax Assessment Total Assessment is a certain percentage of the fair market value that is determined by local assessors to be the total taxable value of land and additions on the property. | Land | Improvement |
|---|---|---|---|---|
| 2025 | $900 | $52,255 | $27,300 | $24,955 |
| 2024 | $834 | $52,255 | $27,300 | $24,955 |
| 2023 | $834 | $52,517 | $28,000 | $24,517 |
| 2022 | $773 | $45,117 | $22,400 | $22,717 |
| 2021 | $716 | $42,950 | $21,000 | $21,950 |
| 2020 | $662 | $42,421 | $20,300 | $22,121 |
| 2019 | $620 | $37,437 | $15,400 | $22,037 |
| 2018 | $592 | $34,739 | $13,300 | $21,439 |
| 2017 | $992 | $33,837 | $11,900 | $21,937 |
| 2016 | $562 | $30,658 | $8,050 | $22,608 |
| 2015 | $559 | $27,051 | $5,600 | $21,451 |
| 2014 | $542 | $17,926 | $4,550 | $13,376 |
Source: Public Records
Map
Nearby Homes
- 316 Linn Ln
- 522 Wheaties Way
- 360 Sir Richard Dr E
- 5854 Heather Marie Dr
- 262 Solicito St
- 332 Sir Jeffery Cir
- 5529 Cedar Ave
- 280 Sir Phillip St
- 266 Lyra Ln
- 147 N Christy Ln
- 5907 Zawawi Ct
- 656 N Christy Ln
- 5364 Awbury Ave
- 5564 Orchard Ln Unit 133
- 5583 Orchard Ln Unit 152
- 730 N Christy Ln
- 5794 Sea Breeze Ave
- 5600 Orchard Ln
- 741 Round Table Dr
- 179 Sir George Dr
- 388 Dolorosa St
- 5638 Reuben St
- 378 Dolorosa St
- 399 Linn Ln
- 5626 Reuben St
- 389 Linn Ln
- 5665 Coaldale Place
- 379 Linn Ln
- 5639 Reuben St
- 5657 Coaldale Place
- 368 Dolorosa St
- 5614 Reuben St
- 5627 Reuben St
- 5681 Coaldale Place
- 369 Linn Ln
- 5625 Kentucky Derby Dr
- 358 Dolorosa St
- 5602 Reuben St
- 5615 Reuben St
- 5650 Coaldale Place