Estimated Value: $178,000 - $215,000
3
Beds
2
Baths
1,118
Sq Ft
$177/Sq Ft
Est. Value
About This Home
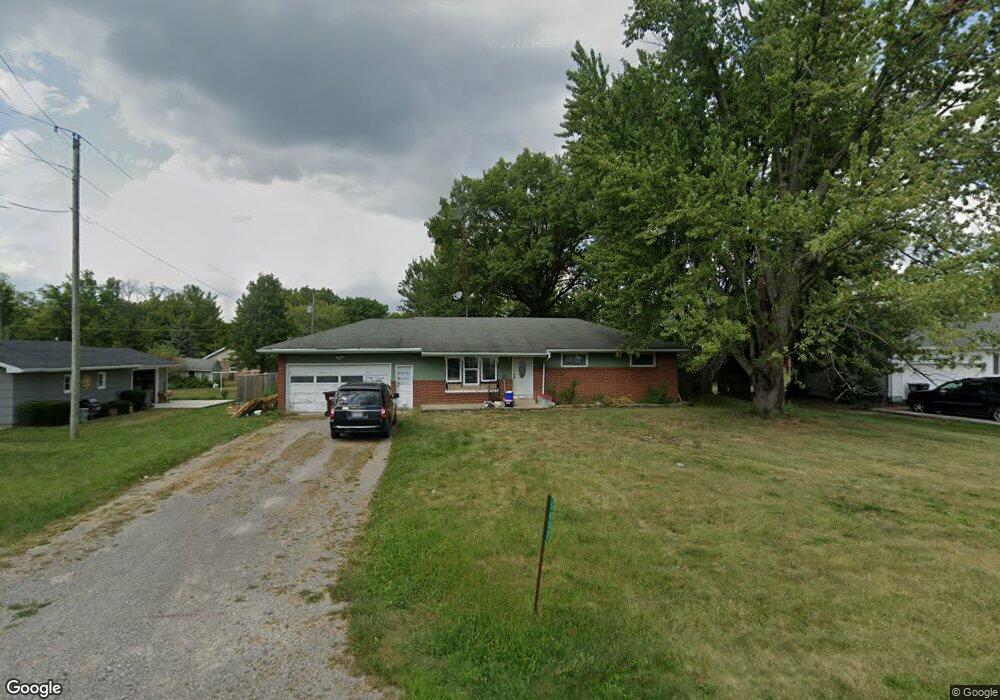
This home is located at 5652 Poling Rd, Lima, OH 45807 and is currently estimated at $198,211, approximately $177 per square foot. 5652 Poling Rd is a home located in Allen County with nearby schools including Elida Elementary School, Elida Middle School, and Elida High School.
Ownership History
Date
Name
Owned For
Owner Type
Purchase Details
Closed on
Jul 3, 2006
Sold by
Lima Superior Community Fuc
Bought by
Point Rachelle A and Point Travis A
Current Estimated Value
Home Financials for this Owner
Home Financials are based on the most recent Mortgage that was taken out on this home.
Original Mortgage
$80,700
Outstanding Balance
$47,165
Interest Rate
6.37%
Mortgage Type
Adjustable Rate Mortgage/ARM
Estimated Equity
$151,046
Purchase Details
Closed on
Feb 1, 2006
Sold by
Maloney Robert J and Maloney Robert Joseph
Bought by
Lima Superior Community Fcu and Nka Superior Fcu
Purchase Details
Closed on
Dec 28, 2000
Sold by
Starr Ruth E
Bought by
Campbell Craig A and Campbell Mae C
Home Financials for this Owner
Home Financials are based on the most recent Mortgage that was taken out on this home.
Original Mortgage
$55,000
Interest Rate
7.8%
Mortgage Type
New Conventional
Purchase Details
Closed on
Jan 1, 1990
Bought by
Starr Ruth Elizabeth
Create a Home Valuation Report for This Property
The Home Valuation Report is an in-depth analysis detailing your home's value as well as a comparison with similar homes in the area
Purchase History
| Date | Buyer | Sale Price | Title Company |
|---|---|---|---|
| Point Rachelle A | $85,000 | None Available | |
| Lima Superior Community Fcu | -- | None Available | |
| Campbell Craig A | $75,000 | -- | |
| Starr Ruth Elizabeth | -- | -- |
Source: Public Records
Mortgage History
| Date | Status | Borrower | Loan Amount |
|---|---|---|---|
| Open | Point Rachelle A | $80,700 | |
| Previous Owner | Campbell Craig A | $55,000 |
Source: Public Records
Tax History
| Year | Tax Paid | Tax Assessment Tax Assessment Total Assessment is a certain percentage of the fair market value that is determined by local assessors to be the total taxable value of land and additions on the property. | Land | Improvement |
|---|---|---|---|---|
| 2024 | $2,721 | $47,390 | $10,010 | $37,380 |
| 2023 | $2,400 | $35,640 | $7,530 | $28,110 |
| 2022 | $2,436 | $35,640 | $7,530 | $28,110 |
| 2021 | $2,445 | $35,640 | $7,530 | $28,110 |
| 2020 | $2,383 | $31,960 | $7,110 | $24,850 |
| 2019 | $2,383 | $31,960 | $7,110 | $24,850 |
| 2018 | $2,670 | $31,960 | $7,110 | $24,850 |
| 2017 | $2,159 | $29,690 | $7,110 | $22,580 |
| 2016 | $2,492 | $29,690 | $7,110 | $22,580 |
| 2015 | $1,885 | $29,690 | $7,110 | $22,580 |
| 2014 | $1,885 | $26,500 | $6,970 | $19,530 |
| 2013 | $1,875 | $26,500 | $6,970 | $19,530 |
Source: Public Records
Map
Nearby Homes
- 1955 Dutch Hollow Rd
- 2105 Dutch Hollow Rd
- 5126 Pheasant St
- 4864 Pheasant St
- 0000 Baty Rd
- 2877 Whippoorwill Ave
- 2848 Hummingbird St
- 3055 Freyer Rd
- 000 Hummingbird St
- 2568 Susan Ann Dr
- 0 Alix Dr
- 2561 Baty Rd
- 5643 Clover Ridge Dr
- 000 N Stevick Rd
- 0000 N Stevick Rd
- 00 Allentown Rd
- 3953 Willow Oak Trail
- 3721 Comanche
- 3619 Comanche Dr
- 3624 Comanche Dr
Your Personal Tour Guide
Ask me questions while you tour the home.