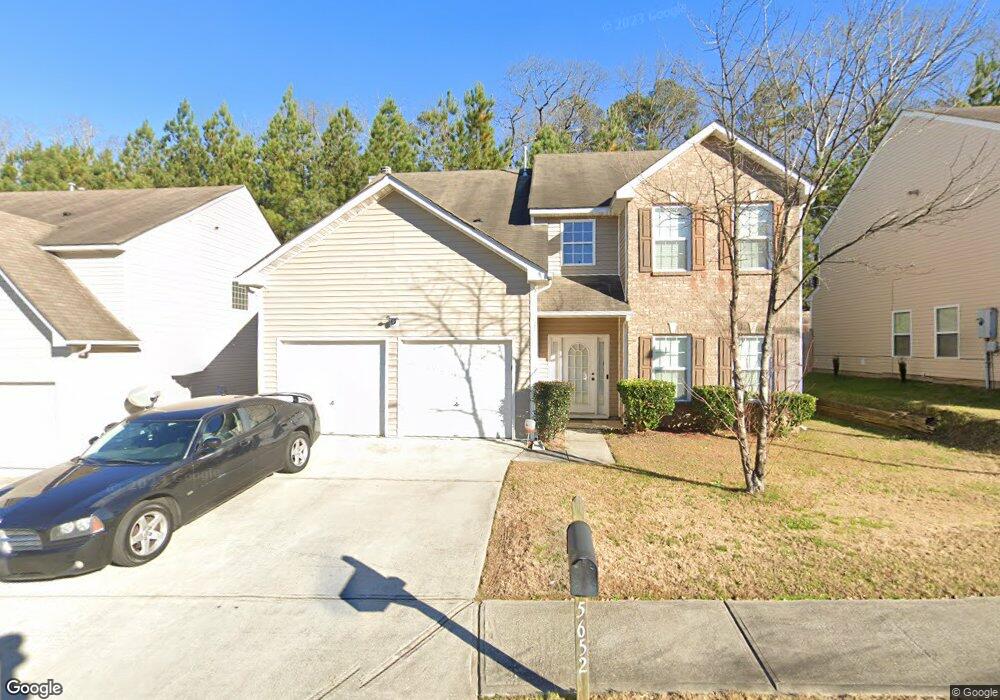
5652 Savannah River Rd Atlanta, GA 30349
Estimated Value: $282,000 - $339,000
4
Beds
3
Baths
2,022
Sq Ft
$149/Sq Ft
Est. Value
About This Home
This home is located at 5652 Savannah River Rd, Atlanta, GA 30349 and is currently estimated at $300,849, approximately $148 per square foot. 5652 Savannah River Rd is a home located in Clayton County with nearby schools including Northcutt Elementary School, North Clayton Middle School, and North Clayton High School.
Ownership History
Date
Name
Owned For
Owner Type
Purchase Details
Closed on
Apr 26, 2017
Sold by
Tabb Angela
Bought by
Moreno Jose A
Current Estimated Value
Home Financials for this Owner
Home Financials are based on the most recent Mortgage that was taken out on this home.
Original Mortgage
$143,010
Outstanding Balance
$119,061
Interest Rate
4.14%
Mortgage Type
VA
Estimated Equity
$181,788
Purchase Details
Closed on
Oct 21, 2011
Sold by
Compass Bank
Bought by
Tabb Angela
Home Financials for this Owner
Home Financials are based on the most recent Mortgage that was taken out on this home.
Original Mortgage
$77,972
Interest Rate
4.87%
Mortgage Type
FHA
Purchase Details
Closed on
Dec 14, 2004
Sold by
West Fayetteville Assocs Llc
Bought by
Rivers Station Dev Llc
Home Financials for this Owner
Home Financials are based on the most recent Mortgage that was taken out on this home.
Original Mortgage
$7,600,000
Interest Rate
5.57%
Create a Home Valuation Report for This Property
The Home Valuation Report is an in-depth analysis detailing your home's value as well as a comparison with similar homes in the area
Home Values in the Area
Average Home Value in this Area
Purchase History
| Date | Buyer | Sale Price | Title Company |
|---|---|---|---|
| Moreno Jose A | $140,000 | -- | |
| Tabb Angela | $80,000 | -- | |
| Rivers Station Dev Llc | -- | -- |
Source: Public Records
Mortgage History
| Date | Status | Borrower | Loan Amount |
|---|---|---|---|
| Open | Moreno Jose A | $143,010 | |
| Previous Owner | Tabb Angela | $77,972 | |
| Previous Owner | Tabb Angela | $5,000 | |
| Previous Owner | Rivers Station Dev Llc | $7,600,000 |
Source: Public Records
Tax History Compared to Growth
Tax History
| Year | Tax Paid | Tax Assessment Tax Assessment Total Assessment is a certain percentage of the fair market value that is determined by local assessors to be the total taxable value of land and additions on the property. | Land | Improvement |
|---|---|---|---|---|
| 2024 | $471 | $128,120 | $9,600 | $118,520 |
| 2023 | $3,912 | $108,360 | $9,600 | $98,760 |
| 2022 | $3,231 | $91,360 | $9,600 | $81,760 |
| 2021 | $2,243 | $65,840 | $9,600 | $56,240 |
| 2020 | $2,103 | $61,636 | $9,600 | $52,036 |
| 2019 | $2,039 | $59,297 | $9,600 | $49,697 |
| 2018 | $1,821 | $53,922 | $9,600 | $44,322 |
| 2017 | $2,051 | $49,471 | $9,600 | $39,871 |
| 2016 | $1,686 | $40,502 | $9,600 | $30,902 |
| 2015 | $1,725 | $0 | $0 | $0 |
| 2014 | $1,442 | $35,295 | $9,600 | $25,695 |
Source: Public Records
Map
Nearby Homes
- 5728 Norman Ct
- 5768 Grande River Rd
- 1853 Broad River Rd
- 1615 Potomac Ct
- 3994 Tyne Ct
- 1506 Norman Crossing
- 5668 Williamsburg Trace
- 1610 Chattahoochee Ct
- 2004 St John Ct
- 5498 Park Place S
- 5761 Antelope Trail
- 5738 Antelope Trail
- 5709 Chisolm Trail
- 5461 Park Place S
- 1618 Blossom Dr
- 5467 Northcut Dr
- 5854 El Segundo Way
- 1460 Flat Shoals Rd
- 5652 Savannah Rd
- 5658 Savannah River Rd
- 5646 Savannah River Rd
- 5664 Savannah River Rd
- 5829 Savannah River Rd Unit 41C
- 5829 Savannah River Rd
- 5651 Savannah River Rd
- 5657 Savannah River Rd
- 5670 Savannah River Rd
- 5645 Savannah River Rd
- 0 Savannah River Rd Unit 8709846
- 0 Savannah River Rd Unit 8599022
- 0 Savannah River Rd Unit 8588027
- 0 Savannah River Rd Unit 8580292
- 0 Savannah River Rd Unit 8581196
- 0 Savannah River Rd Unit 8577915
- 0 Savannah River Rd Unit 8559042
- 0 Savannah River Rd Unit 8541608
- 0 Savannah River Rd Unit 8529272
- 0 Savannah River Rd Unit 8526041