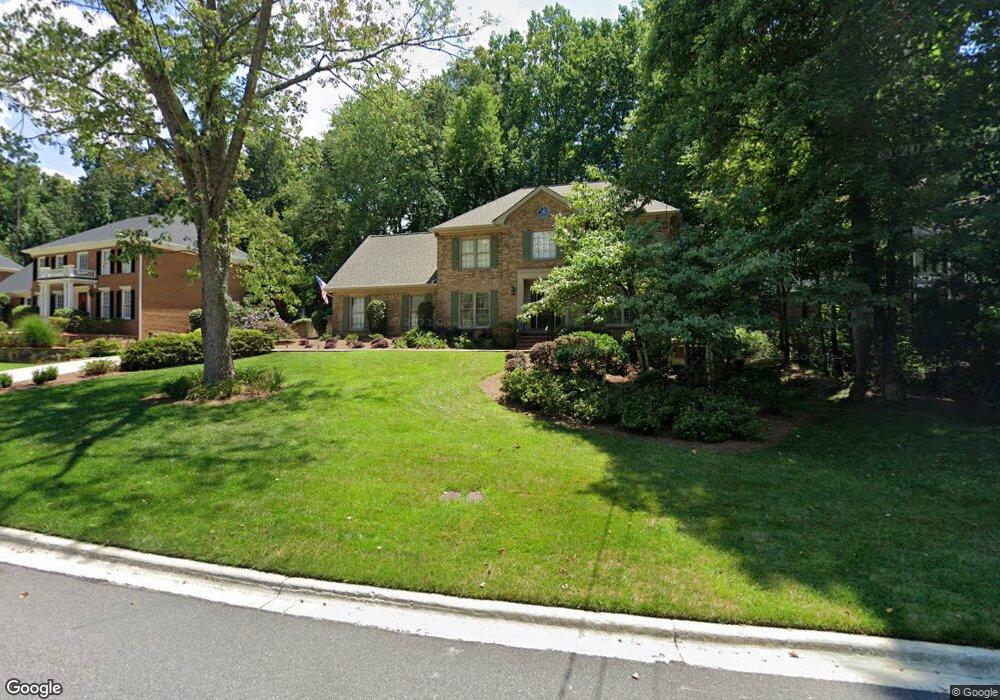
5655 Broxton Cir Unit 5 Norcross, GA 30092
Estimated Value: $680,290 - $862,000
4
Beds
3
Baths
3,023
Sq Ft
$254/Sq Ft
Est. Value
About This Home
This home is located at 5655 Broxton Cir Unit 5, Norcross, GA 30092 and is currently estimated at $768,323, approximately $254 per square foot. 5655 Broxton Cir Unit 5 is a home located in Gwinnett County with nearby schools including Simpson Elementary School, Pinckneyville Middle School, and Norcross High School.
Ownership History
Date
Name
Owned For
Owner Type
Purchase Details
Closed on
Jan 29, 2021
Sold by
Gates Robert D
Bought by
Gates Robert D and Gates Pamela Hamilton
Current Estimated Value
Purchase Details
Closed on
Mar 29, 2006
Sold by
Mujica Hernan E and Mujica Karen Mujica
Bought by
Gates Robert D
Home Financials for this Owner
Home Financials are based on the most recent Mortgage that was taken out on this home.
Original Mortgage
$300,000
Interest Rate
6.23%
Mortgage Type
New Conventional
Purchase Details
Closed on
Jun 16, 1995
Sold by
Jones Harley T Bonnie W
Bought by
Mujica Hernan E M Karen
Create a Home Valuation Report for This Property
The Home Valuation Report is an in-depth analysis detailing your home's value as well as a comparison with similar homes in the area
Home Values in the Area
Average Home Value in this Area
Purchase History
| Date | Buyer | Sale Price | Title Company |
|---|---|---|---|
| Gates Robert D | -- | -- | |
| Gates Robert D | $398,000 | -- | |
| Mujica Hernan E M Karen | $213,500 | -- |
Source: Public Records
Mortgage History
| Date | Status | Borrower | Loan Amount |
|---|---|---|---|
| Previous Owner | Gates Robert D | $300,000 | |
| Closed | Mujica Hernan E M Karen | $0 |
Source: Public Records
Tax History Compared to Growth
Tax History
| Year | Tax Paid | Tax Assessment Tax Assessment Total Assessment is a certain percentage of the fair market value that is determined by local assessors to be the total taxable value of land and additions on the property. | Land | Improvement |
|---|---|---|---|---|
| 2025 | $7,204 | $272,360 | $50,160 | $222,200 |
| 2024 | $6,837 | $245,280 | $44,000 | $201,280 |
| 2023 | $6,837 | $245,280 | $44,000 | $201,280 |
| 2022 | $6,396 | $223,360 | $36,000 | $187,360 |
| 2021 | $5,649 | $181,440 | $35,520 | $145,920 |
| 2020 | $5,689 | $181,440 | $35,520 | $145,920 |
| 2019 | $5,312 | $171,040 | $30,000 | $141,040 |
| 2018 | $5,332 | $171,040 | $30,000 | $141,040 |
| 2016 | $4,805 | $148,560 | $24,000 | $124,560 |
| 2015 | $4,855 | $148,560 | $24,000 | $124,560 |
| 2014 | $4,742 | $148,560 | $24,000 | $124,560 |
Source: Public Records
Map
Nearby Homes
- 5786 Broxton Cir
- 3962 Gunnin Rd
- 5649 Whitesburg Ct
- 4102 Ailey Ct
- 4053 Spalding Hollow NW
- 5885 Match Point
- 3922 Glen Meadow Dr
- 3723 Orchard St
- 3910 Spalding Bluff Dr
- 5961 Ranger Ct
- 6169 Poplar Bluff Cir
- 5970 Rachel Ridge Unit 2
- 6027 Peachmont Terrace
- 507 Peachtree Forest Terrace
- 4570 Waterside Pkwy
- 601 Peachtree Forest Ave
- 3553 Corners Way
- 4944 Sealy Cir
- 5665 Broxton Cir
- 5635 Broxton Cir Unit 5
- 5660 Broxton Cir
- 5773 Martech Ct
- 5656 Broxton Cir
- 5666 Broxton Cir Unit 5
- 5675 Broxton Cir
- 5763 Martech Ct
- 5625 Broxton Cir
- 5646 Broxton Cir
- 5783 Martech Ct
- 5636 Broxton Cir
- 0 Martech Ct Unit 7195685
- 0 Martech Ct
- 5676 Broxton Cir
- 5753 Martech Ct
- 5626 Broxton Cir
- 5626 Broxton Cir Unit LOT 18
- 5685 Broxton Cir Unit 5
- 5615 Broxton Cir