Estimated Value: $1,346,000 - $1,441,000
About This Home
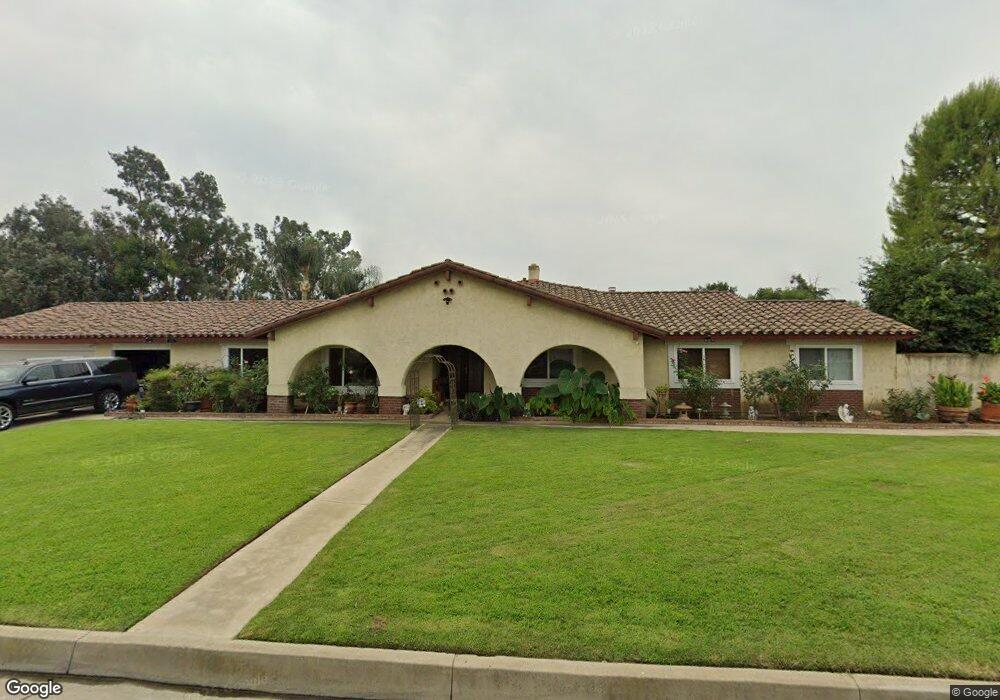
This home is located at 5655 Juniper St, Chino, CA 91710 and is currently estimated at $1,385,102, approximately $365 per square foot. 5655 Juniper St is a home located in San Bernardino County with nearby schools including E. J. Marshall Elementary, Magnolia Junior High, and Chino High School.
Ownership History
We collect this data history from publicly available records. To have your information removed, we recommend requesting removal directly through your county’s website.
Purchase Details
Home Financials for this Owner
Home Financials are based on the most recent Mortgage that was taken out on this home.Home Values in the Area
Average Home Value in this Area
Purchase History
We collect this data history from publicly available records. To have your information removed, we recommend requesting removal directly through your county’s website.
| Date | Buyer | Sale Price | Title Company |
|---|---|---|---|
| $270,000 | First American Title Ins Co |
Mortgage History
We collect this data history from publicly available records. To have your information removed, we recommend requesting removal directly through your county’s website.
| Date | Status | Borrower | Loan Amount |
|---|---|---|---|
| Previous Owner | $243,000 |
Tax History
We collect this data history from publicly available records. To have your information removed, we recommend requesting removal directly through your county’s website.
| Year | Tax Paid | Tax Assessment Tax Assessment Total Assessment is a certain percentage of the fair market value that is determined by local assessors to be the total taxable value of land and additions on the property. | Land | Improvement |
|---|---|---|---|---|
| 2025 | $5,608 | $502,797 | $130,293 | $372,504 |
| 2024 | $5,458 | $492,938 | $127,738 | $365,200 |
| 2023 | $5,307 | $483,272 | $125,233 | $358,039 |
| 2022 | $5,276 | $473,796 | $122,777 | $351,019 |
| 2021 | $5,173 | $464,506 | $120,370 | $344,136 |
| 2020 | $5,106 | $459,743 | $119,136 | $340,607 |
| 2019 | $5,017 | $450,728 | $116,800 | $333,928 |
| 2018 | $4,906 | $441,890 | $114,510 | $327,380 |
| 2017 | $4,819 | $433,226 | $112,265 | $320,961 |
| 2016 | $4,503 | $424,732 | $110,064 | $314,668 |
| 2015 | $4,412 | $418,352 | $108,411 | $309,941 |
| 2014 | $4,325 | $410,157 | $106,287 | $303,870 |
Map
- 11873 Seneca Way
- 1433 S Jasmine Ave
- 2032 S Helen Ave
- 11868 Cayuga Place Unit 138
- 1664 S Elderberry St
- 1428 S Helen Ave
- 11936 Ottawa Place Unit 87
- 1701 S Elderberry St
- 11591 Cantara Dr
- 11557 Cantara Dr
- 5219 Azul Dr
- 1434 W Philadelphia St
- 1710 S Mountain Ave Unit B
- 1604 S Mountain Ave Unit D
- 1604 S Mountain Ave Unit 7A
- 5383 Howard St
- 2069 S Magnolia Ave Unit 123
- 2139 S Magnolia Ave
- 2015 S Mountain Ave
- 1158 W Philadelphia St
- 5635 Juniper St
- 5677 Juniper St
- 5646 Francis Ave
- 5676 Francis Ave
- 11622 Santa Anita Ave
- 5676 Juniper St
- 5654 Juniper St
- 5606 Francis Ave
- 1742 S Jasmine Ct
- 11588 Santa Anita Ave
- 1758 S Jasmine Ct
- 1770 S Jasmine Ct
- 1758 W Francis St Unit A
- 1730 S Jasmine Ct
- 11575 Santa Anita Ave
- 11570 Benson Ave
- 5633 Francis Ave
- 5580 Francis Ave
- 11600 Benson Ave
- 5607 Locust St
Ask me questions while you tour the home.